- Home >
- Stock Photos >
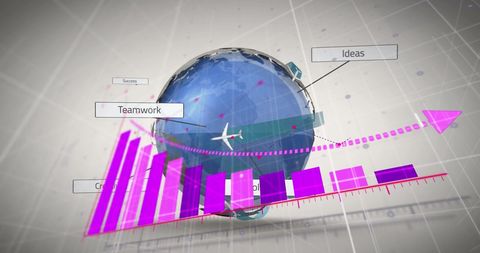
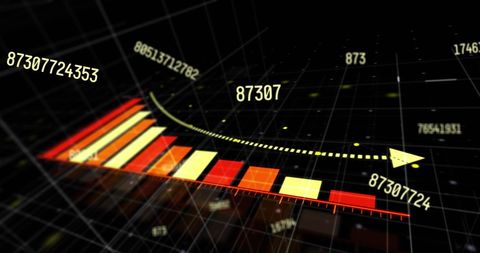
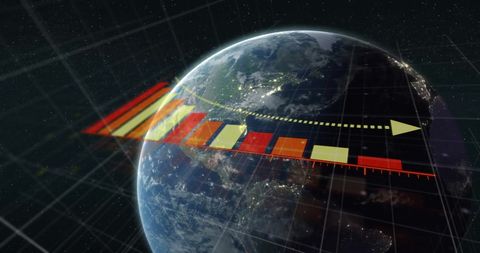
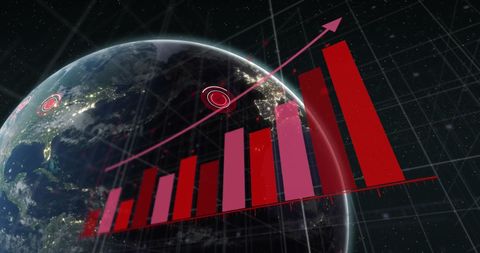
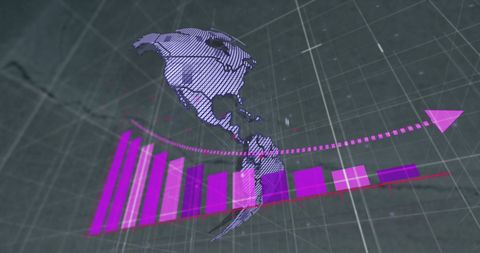
- Holographic Financial Graph Showing Downward Trend
Holographic Financial Graph Showing Downward Trend Image

Visualization of a holographic graph descending over a rotating globe illustrates economic or financial reduction. Ideal for use in media related to business trends, global economy, financial forecasts, and technology assessments. Useful for presentations, articles, and reports addressing topics of economic downturns and analytics.
Powered by 


downloads
Tags:
More
Credit Photo
If you would like to credit the Photo, here are some ways you can do so
Text Link
photo Link
<span class="text-link">
<span>
<a target="_blank" href=https://pikwizard.com/photo/holographic-financial-graph-showing-downward-trend/c30fd518d059ced442bbf65a746dbdfc/>PikWizard</a>
</span>
</span>
<span class="image-link">
<span
style="margin: 0 0 20px 0; display: inline-block; vertical-align: middle; width: 100%;"
>
<a
target="_blank"
href="https://pikwizard.com/photo/holographic-financial-graph-showing-downward-trend/c30fd518d059ced442bbf65a746dbdfc/"
style="text-decoration: none; font-size: 10px; margin: 0;"
>
<img src="https://pikwizard.com/pw/medium/c30fd518d059ced442bbf65a746dbdfc.jpg" style="margin: 0; width: 100%;" alt="" />
<p style="font-size: 12px; margin: 0;">PikWizard</p>
</a>
</span>
</span>
Free (free of charge)
Free for personal and commercial use.
Author: Authentic Images
Similar Free Stock Images
Loading...

Premium


Premium


Premium


Premium


Premium


Premium

Premium
Premium


Premium


Premium


Premium


Premium

Premium


Premium


Premium
Premium


Premium


Premium
Premium


Premium

Premium


Premium


Premium


Premium


Premium