1. Home > 
  2. Stock Photos > 
  3. Holographic Financial Graphs Over Blue Background

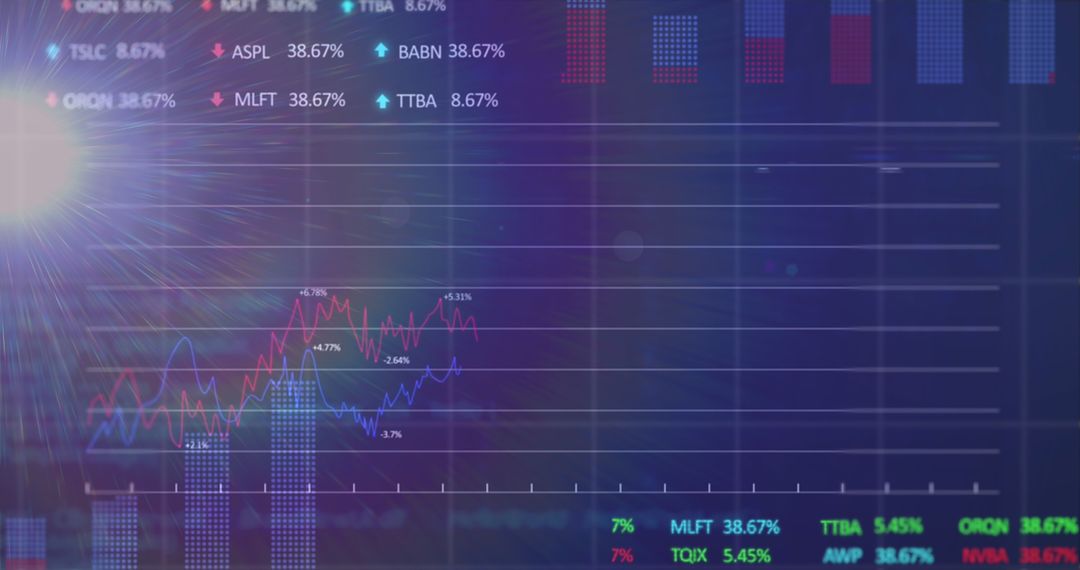
Holographic Financial Graphs Over Blue Background Image

Holographic Financial Graphs Over Blue Background

Illustration displaying dynamic financial graphs and trading data overlayed on a blue background, representing a hologram effect. Useful for business presentations, articles on finance, or educational material detailing market trends and stock analytics.

Powered by Adobe logo
Hand reaching towards glowing buy and sell stock market trading icons - Powered by AdobeClose up of a person s hand holding a glowing futuristic holographic projection of a rising stock market graph and financial data - Powered by AdobePerson using tablet displaying holographic financial charts and graphs financial data analytics - Powered by AdobeBusiness professional interacting with futuristic holographic financial data on a desk - Powered by AdobeBusiness professional analyzing financial data with holographic charts and graphs on a desk - Powered by Adobe

Credit Photo

If you would like to credit the Photo, here are some ways you can do so

Free (free of charge)

Free for personal and commercial use.

Author: Creative Art

Similar Free Stock Images

Dynamic Stock Market Ticker Display with Financial Graphs
Premium
Photography of a Virtual financial stock market graph with upward trending lines and candlestick charts on the background of an urban skyline.
Global Finance and Data Visualization Interface Background
Financial Data with Ukraine Flag Illustrates Economic Impact
Financial Graph Data Overlay with Modern Cityscape Background
Dynamic Stock Market Data on Digital Display Background
Premium
Businessman interacting with futuristic financial growth chart hologram
Statistical Data on Orange Gradient Background
Dynamic Stock Market Trends and Data Visualizations
Dynamic Financial Data on Digital Interface
Abstract Financial Data and Cityscape on Green Background
Premium
Digital Strategy Wireframe Hand Moving Chess Piece with Stock Market Data
Stock Market Data Visuals Displaying Financial Analysis Trends
Digital Interface with Global Business Data Visualization
Digital Financial Graph Illustrating Stock Market Trends
Dynamic Stock Market Data Visualizing Global Economic Trends
Premium
Holographic profit graph displayed in modern office representing financial success
Financial Data with Trend Lines and Bar Charts
Digital Financial Data Analysis with Vibrant Graphs
Innovative Digital Monthly Growth Chart Background for Data Analysis
Digital Financial Data Analysis and Stock Market Charting
Premium
Wireframe hand holding magnifying glass over glowing digital stock market graph analysis business
Digital Data Analytics Growth Trend with Graphs
Digital Data Overlay on World Map Representing Global Analytics
Abstract Financial Data with Rising Trend Line on Green
Dynamic Financial Data Growth Chart Display
Premium
Businessman holding a tablet with a hologram of a rising stock market graph and bar chart on the screen, representing a financial data.
Interactive Dashboard with Analytics and Charts
Futuristic Data Visualization with Dynamic Graphs
3D Financial Chart with Candlestick Bars and Trend Lines
Dynamic Financial Data with Glowing Candlestick Chart and Digital Numbers
Digital Stock Market Data Visualization with Rising and Falling Prices
Digital Financial Data Stream with Numeric Overlay
Premium
Futuristic data analytics displayed on holographic screens
Global Financial Markets and Technology Analysis
Futuristic Financial Data Display with Digital Interface
Abstract Financial Data Chart with Light Trails
Abstract Representation of Stock Market Data Overlaying Urban Landscape
Premium
Worried businesswoman reacting to sharp financial market crash with red declining stock graphs over modern office background hologram chart display.
Digital Financial Data Chart and Analytics Interface
Financial Data Analysis Graph with Growing Trends
Digital Cityscape and Data Overlay with Futuristic Interface
Futuristic Data Visualization with Interactive Charts and Numbers
Premium
Businessman interacting a holographic financial graph market growth investment success
Dynamic Stock Market Data Display in Digital Hologram Interface
Dynamic Financial Statistics Overlay on Cityscape Background
Dynamic Financial Data Visualization with Holographic Numbers
Financial Data Analysis with Stock Market Trends and Graphs
Premium
Hand holding a glowing digital financial growth chart with upward trend
Futuristic Data Chart with Digital Interface Elements
Digital Soundwaves with Data Graphs and Coding Elements
Financial Charts Over Cityscape Reflecting Economic Trends
Financial Data Visualization on Dark Background for Analysis
Premium
Person using smartphone with glowing bank building and stock market graph hand
Abstract Financial Graph on Digital Screen with Data Processing Concept
Abstract Digital Data Charts and Graphs on Screen
Futuristic Stock Market Graphs on Digital Display
Abstract Digital Financial Data Graph Chart
Premium
Night woman charts reflection wearing eyeglasses looking computer screen closeup
Digital Analytics Dashboard with Social Media Metrics
Rising Candlestick Chart on Dynamic Digital Financial Display
Neon Financial Dashboard Displaying Market Charts and 38.67% Marker on Tilted Grid Monitor
Digital Finance Interface with Dynamic Trading Data Displays
Digital Financial Data and Dynamic Stock Market Graphs
Financial Data Over Grid Indicating Market Trends and Analytics
Premium
Financial analyst visualizing stock market data with glowing digital graph for business growth and investment strategy planning
Digital Bar Graph Display in Financial Data Analysis
Global Financial Data Analytics with World Map Background
Abstract Data Visualization on Blue Background
Rising Graph with Data and Analysis Objects on Blue Background
Premium
A hand interacts with a glowing cylindrical display showing stock market charts and data, symbolizing financial technology and analysis.
Data Analytics and Stock Market Graphs
Colombian Stock Market Data Amid Colored Background
Dynamic Financial Market Data and Business Technology Concept
Statistical Data and Trends Over Digital Grid Overlay
Premium
Stock photo of a businessman interacting with holographic financial graphs and charts.
Digital Stock Market Data with Graphs and Numbers in Hologram Style
Digital Interface with Data Analytics and Processing Visuals
Abstract Financial Data Analysis with Charts and Figures
Green Holographic Stock Market Data Visualization
Premium
A business professional uses a tablet to analyze key financial data against a dark city skyline, showcasing digital graphs that illustrate market trends and statistics. Scalp
Global Data and Financial Trends with Digital Interface
Financial Data Processing Over Digital Grid
Statistics and Data Processing with Graphs and Charts
Abstract Financial Data Processing Blue Grid Background
Premium
Businessman using smartphone with holographic financial data and stock market analytics
Colorful Data Visualization with Bar Graphs and Statistics Overlay
Financial Data Graphic with Rising Trends on Digital Grid
Dynamic Financial Graph with Data Analysis Conceptual Background
Digital Finance Dashboard with Rising Graph and Percentages
Premium
A rising stock graph hovers over a cupped hand in front of a darksuited figure
Financial Charts with Blue and Red Lines and Digital Percent Indicators
Futuristic Financial Dashboard Showing Layered Market Charts and Colored Trend Lines
Dynamic Financial Data and Stock Market Interface
Abstract Visualization of Financial Data and Digital Analysis
Ukraine Crisis Financial Graphs Overlay
Digital Data Processing Graph Interface with Progress Bar
Premium
Businessman interacting with a futuristic financial growth chart display
Dynamic Financial Charts with Blue Digital Interface
Advanced Financial Data and Stock Market Analysis Background
Trending Financial Graphs with Red and Blue Analytics Lines
Dynamic Digital Data and Technology Interfaces
Premium
Financial market data displayed as a digital chart with multiple graphs and candlestick patterns, representing stock trends and economic analysis
Colombian Flag Merging with Stock Market Graphs Illustrating Economy
Digital Financial Data Graph with Winter Snowflake Theme
Stock Market Trends and Data Analysis over Digital Grid
Colorful Data Analytics Bar Graphs on Digital Screen
Premium
Abstract glowing finance trend chart holographic line graph digital data visualization futuristic technology blue and pink color economic growth modern business optimistic mood
Data Analytics with Dynamic Global Market Trends on Screen
Dynamic Financial Graphs on Digital Screen Displaying Market Trends
Abstract Digital Stock Market Interface with Graphs and Data
Financial Market Data Overlaid on Urban Skyline
Premium
Futuristic fintech dashboard hologram with financial data.
Global Financial Data Analysis on Grid Background
Digital Financial Data Overlaid on Circuit Board Illustration
Financial Data Analytics Over Digital Grid Screen
Abstract Digital Interface of Stock Price Graph Over City View
Premium
Hand holding futuristic screen with stock market up and down arrows
Financial Data Charts with Viewing Grid in Dark Perspective
Digital Graph and Data Analysis with Financial Growth Trends
Financial Analytics Concept with Candlestick Charts and Trend Lines
Dynamic Financial Charts and Stock Market Analytics Display
Premium
Business professional analyzing financial data on a tablet with holographic charts
Subscriber Analytics Dashboard with Candlestick Charts and Line Graphs Showing 477,785 Subscribers