- Home >
- Stock Photos >
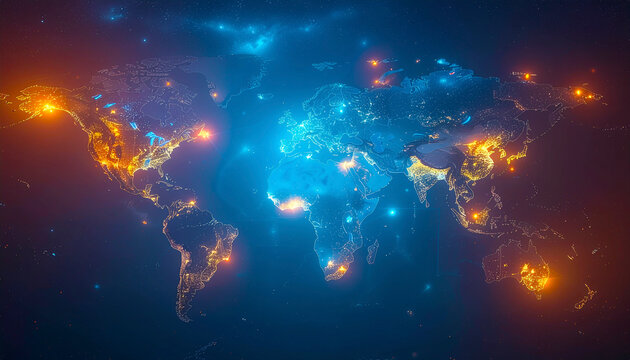
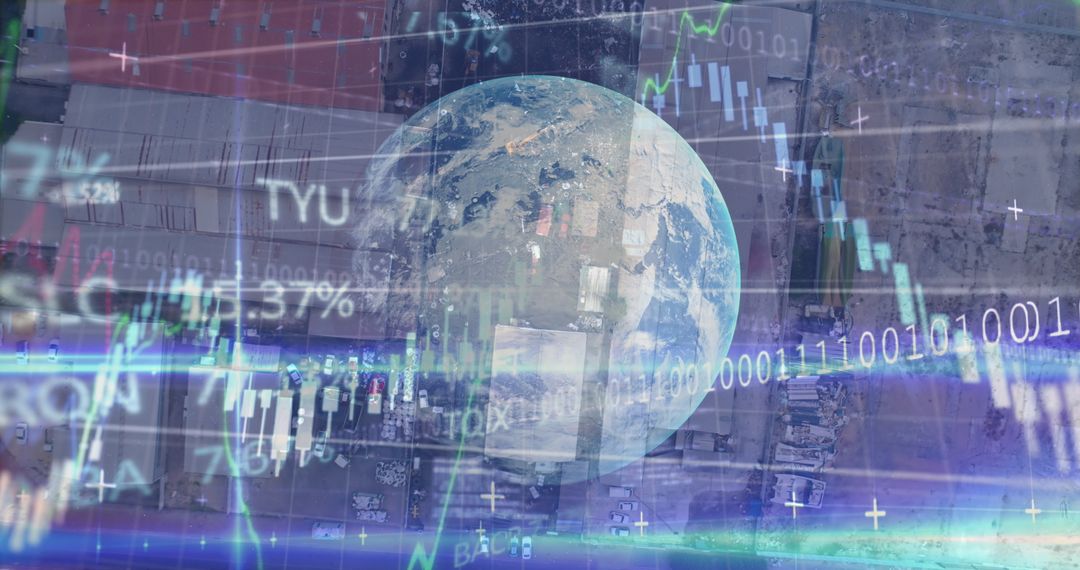
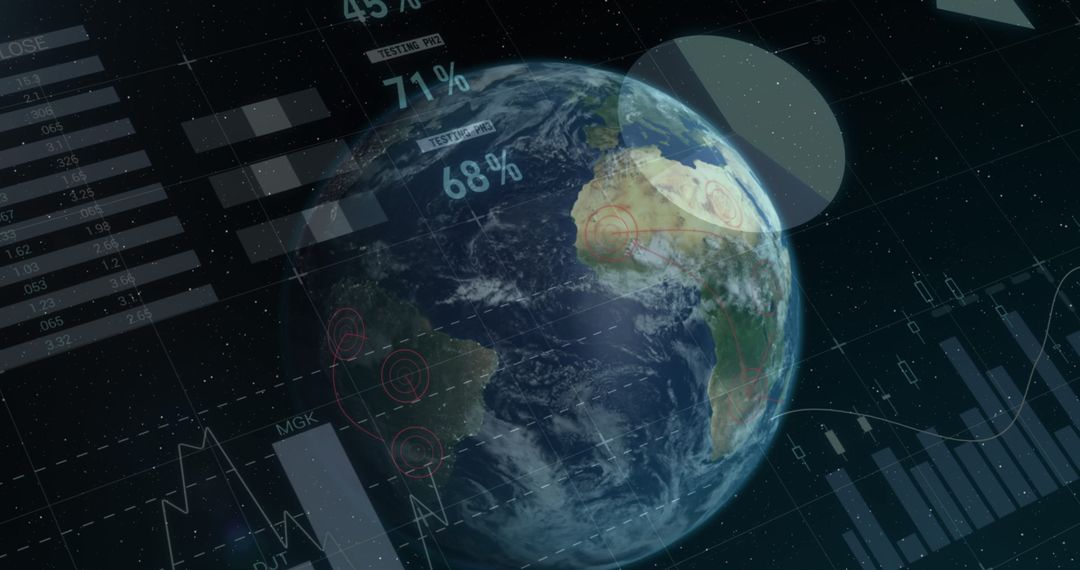
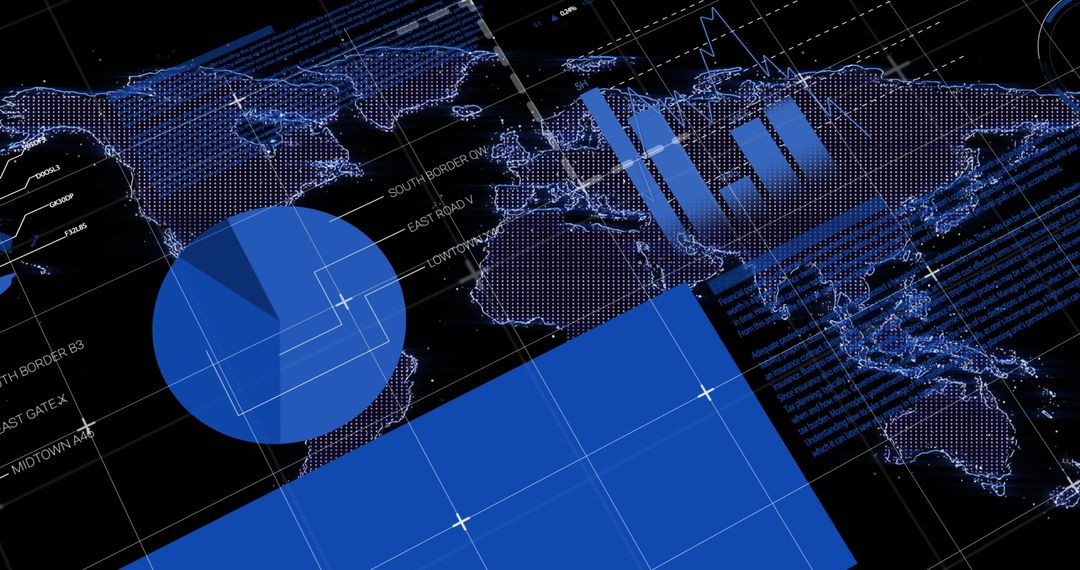
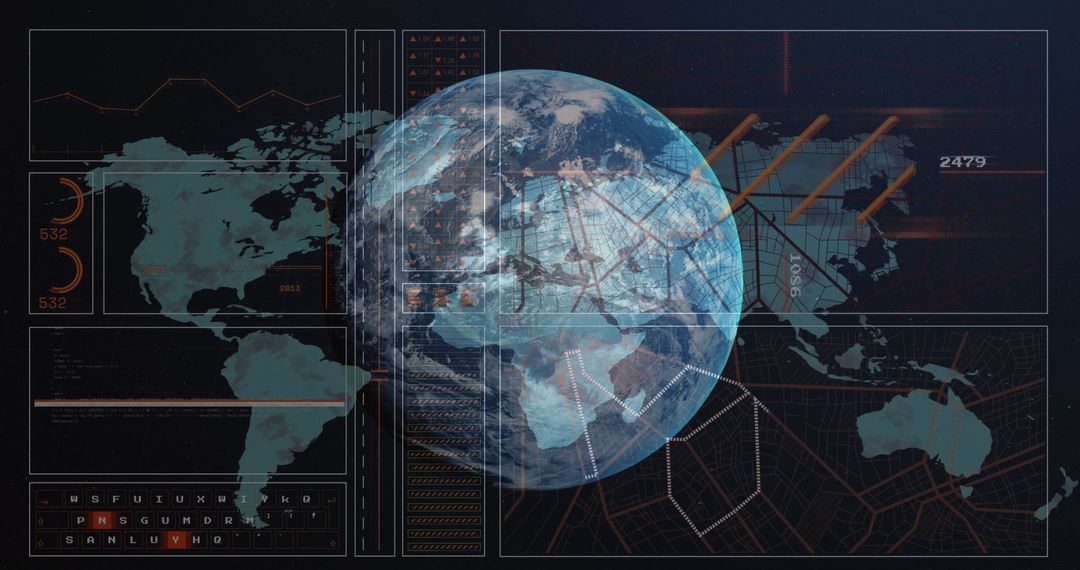
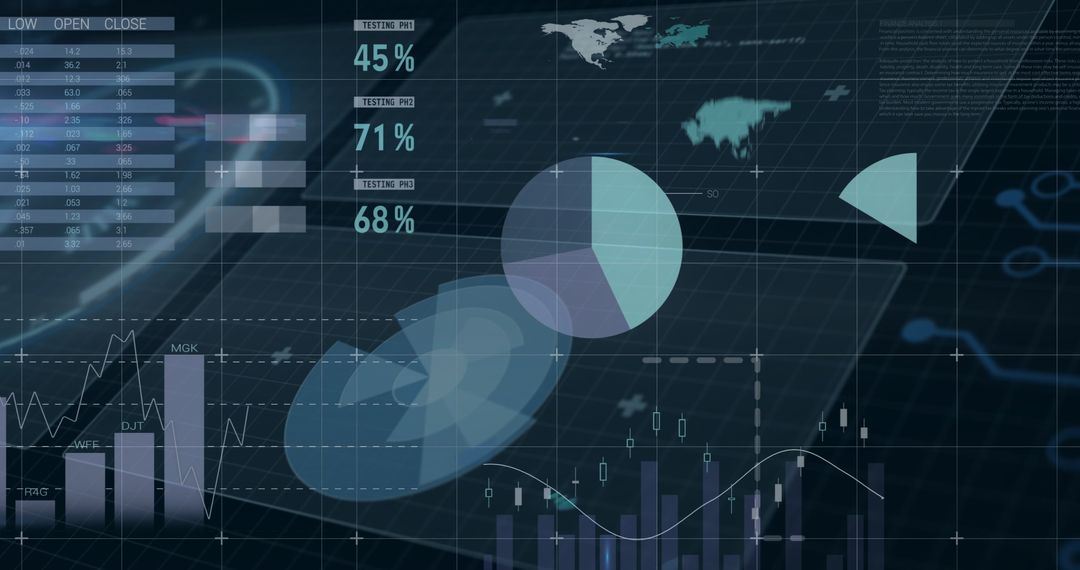
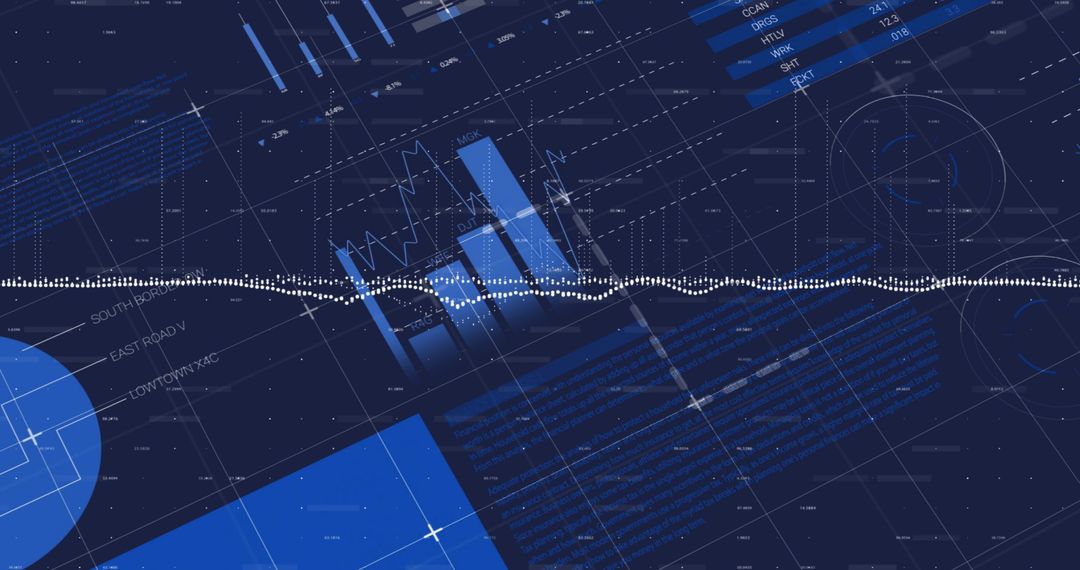
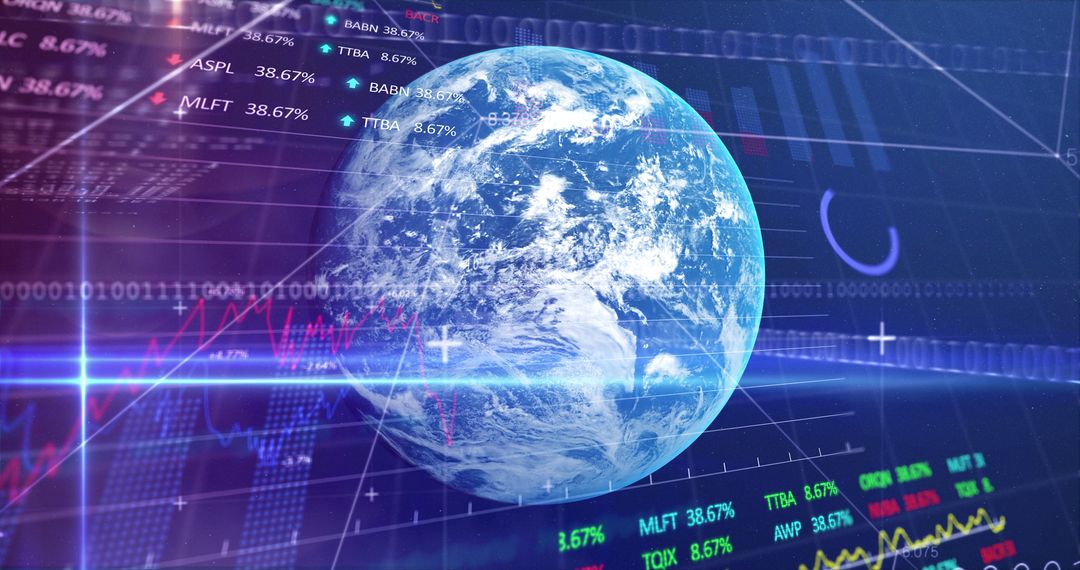
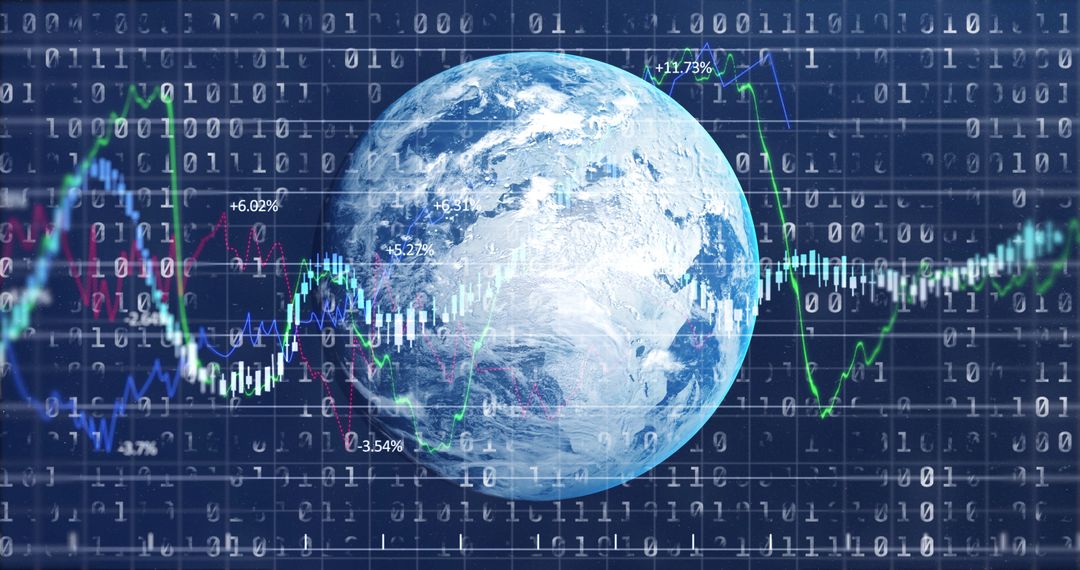
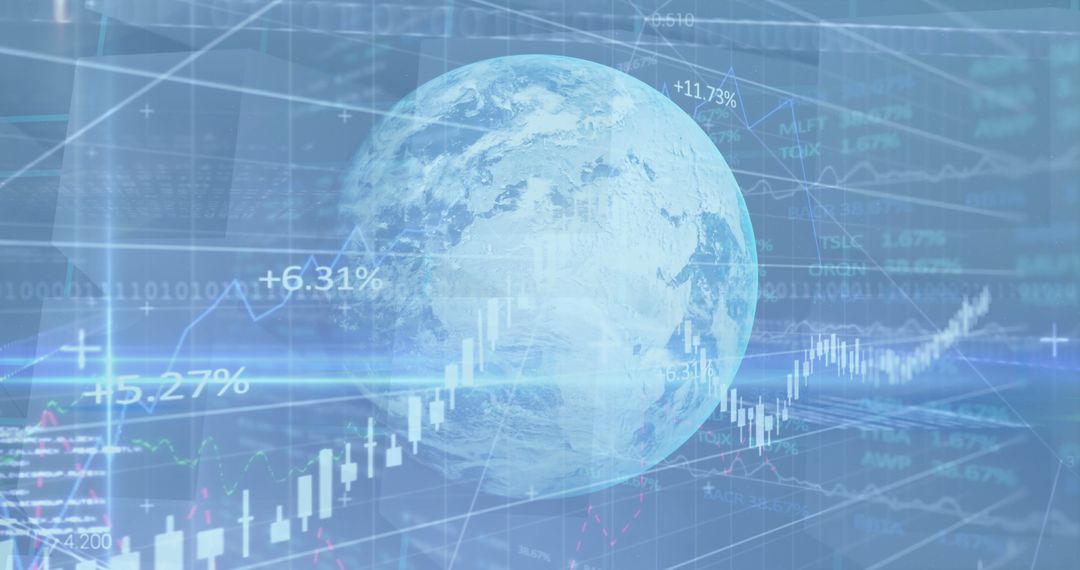
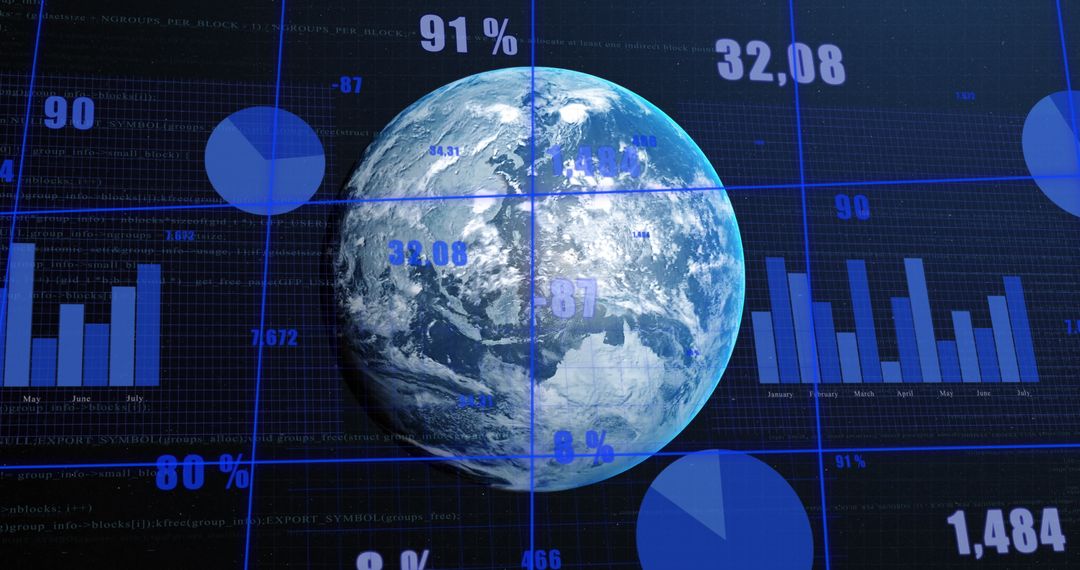
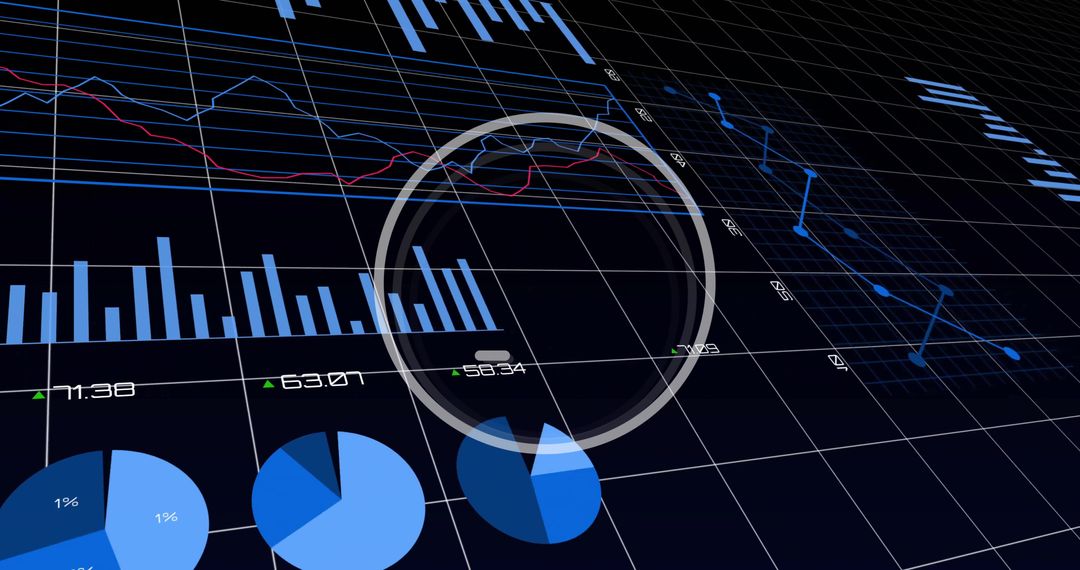
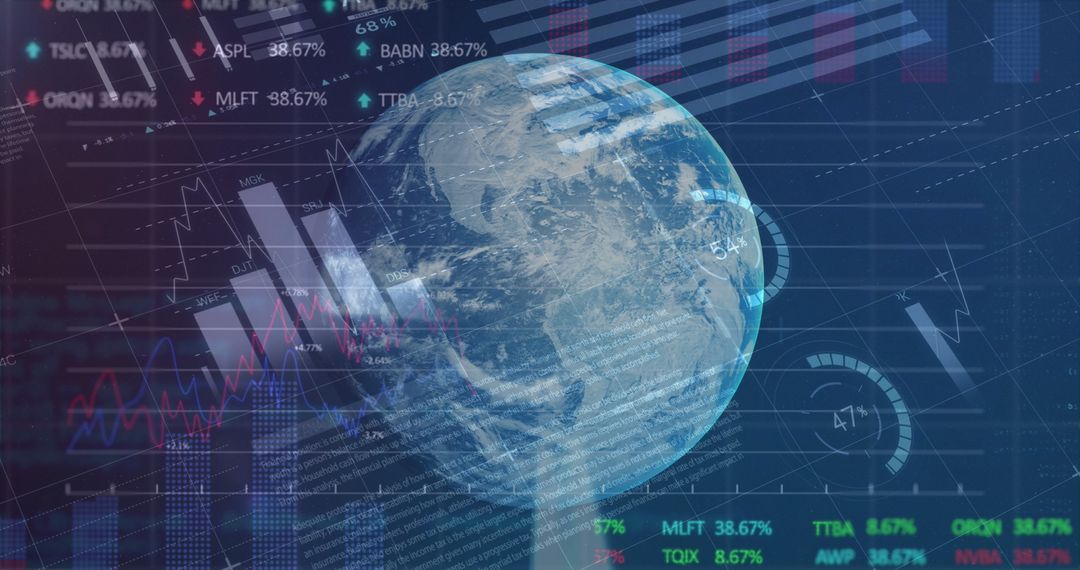
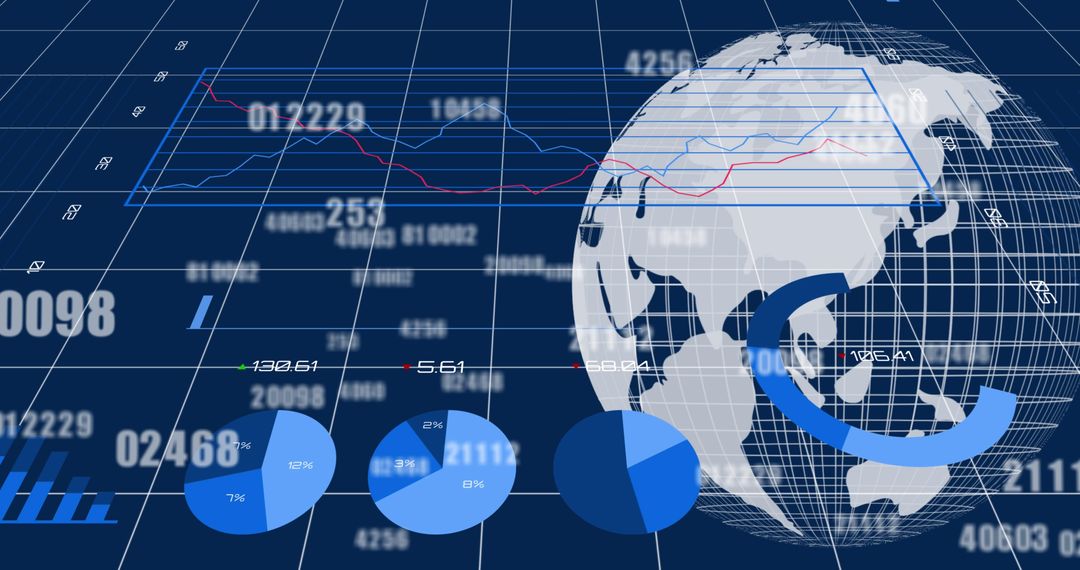
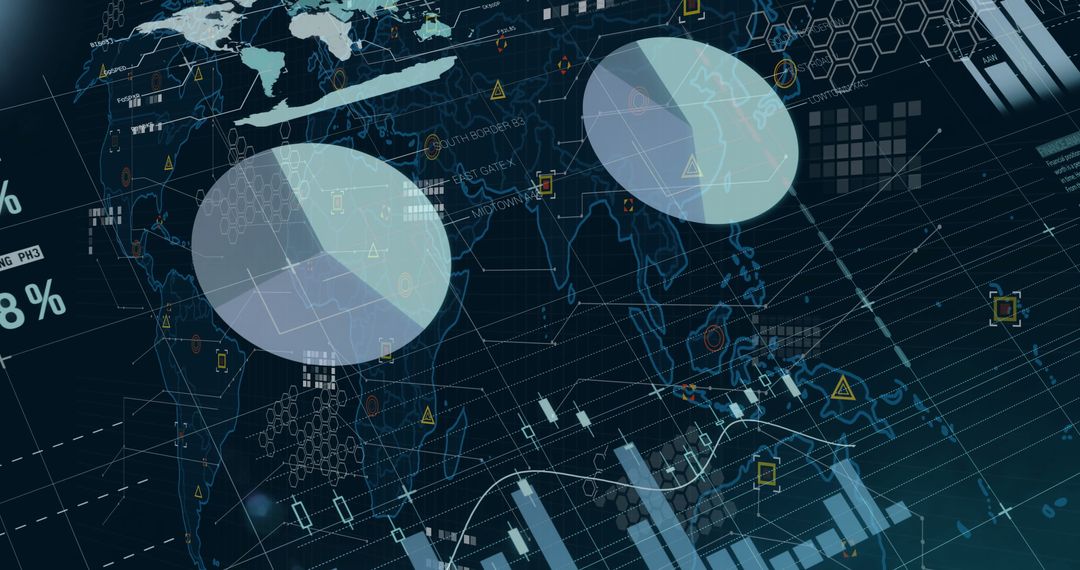
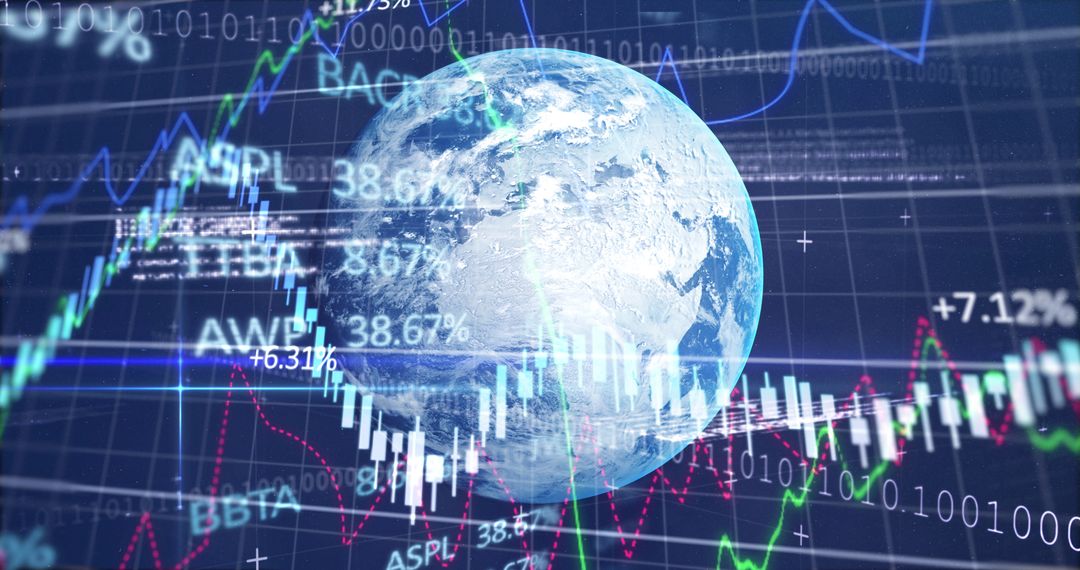
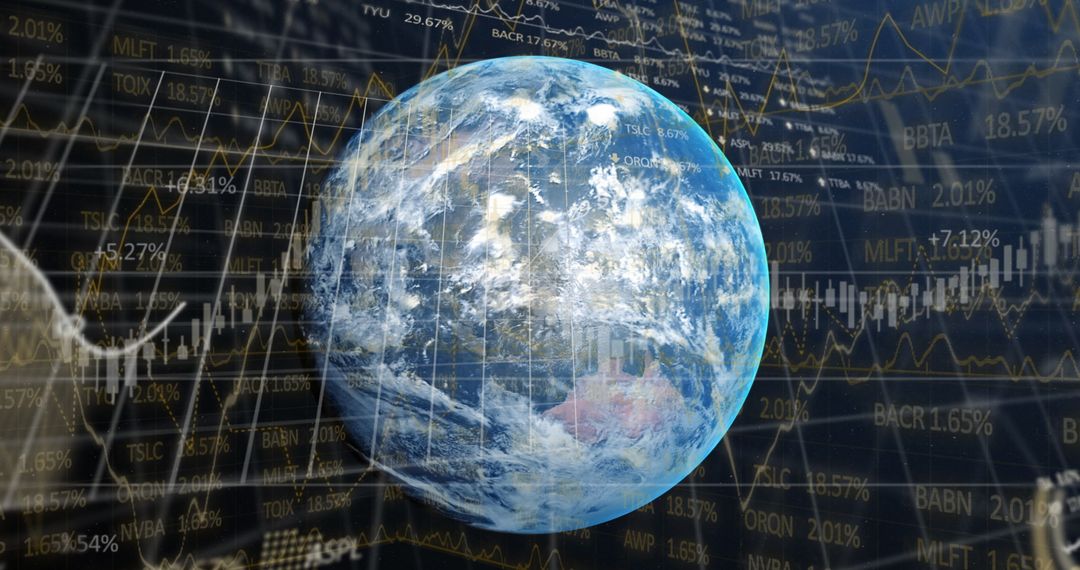
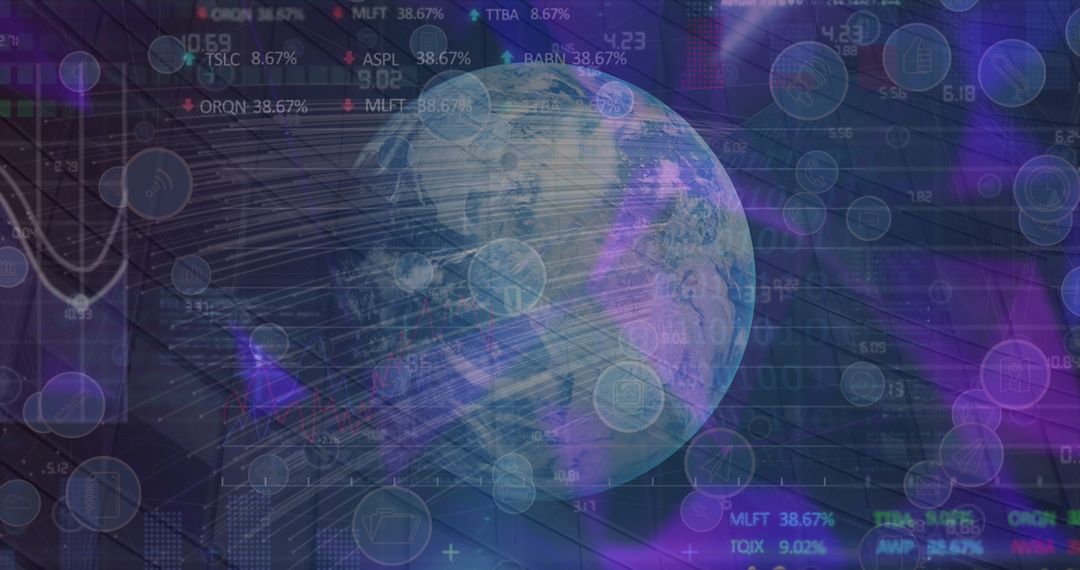
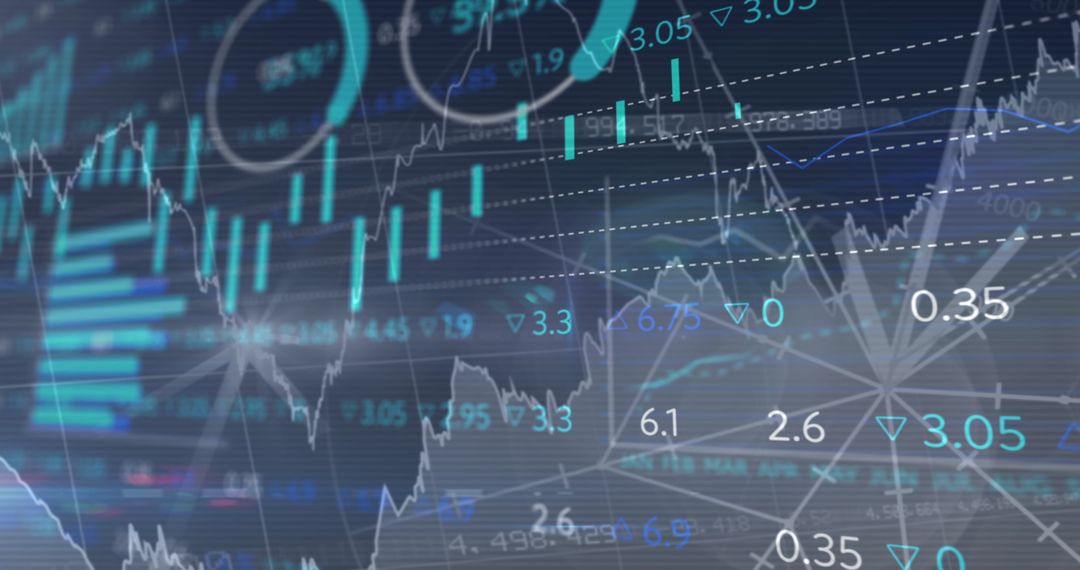
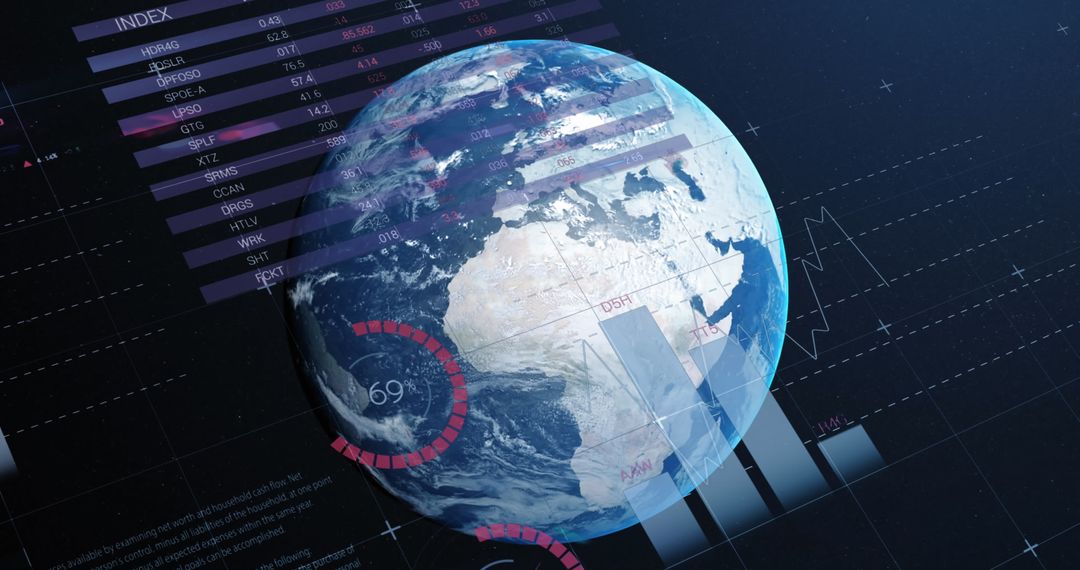
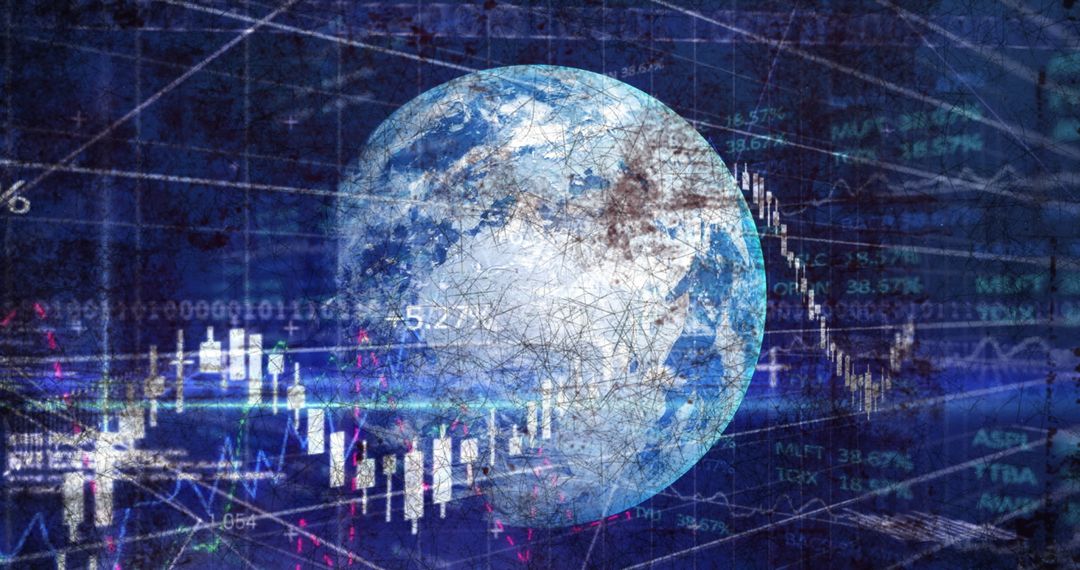
- Holographic Global Market Dashboard with Rotating Earth and Financial Data Visualization
Holographic Global Market Dashboard with Rotating Earth and Financial Data Visualization Image

Showing rotating Earth globe overlaying translucent financial charts, tickers, pie and donut graphs on neon grid. Featuring holographic lines, numeric readouts, and layered graphs conveying global market flow and data-driven decision making. Suiting use for financial reports, fintech websites, investor presentations, business intelligence dashboards, and newsroom graphics. Working well as hero background, slide deck cover, social media campaign visual, or website header with space for overlay text and logos. Featuring neon blue and violet palette and high-contrast elements for modern, futuristic aesthetic. Delivering strong concept for stories about global economy, stock markets, big data analytics, fintech innovation, and digital transformation.
Powered by 


0
downloads
downloads
Tags:
More
Credit Photo
If you would like to credit the Photo, here are some ways you can do so
Text Link
photo Link
<span class="text-link">
<span>
<a target="_blank" href=https://pikwizard.com/photo/holographic-global-market-dashboard-with-rotating-earth-and-financial-data-visualization/066d5cb17d92ebcefee1fadeb6597f49/>PikWizard</a>
</span>
</span>
<span class="image-link">
<span
style="margin: 0 0 20px 0; display: inline-block; vertical-align: middle; width: 100%;"
>
<a
target="_blank"
href="https://pikwizard.com/photo/holographic-global-market-dashboard-with-rotating-earth-and-financial-data-visualization/066d5cb17d92ebcefee1fadeb6597f49/"
style="text-decoration: none; font-size: 10px; margin: 0;"
>
<img src="https://pikwizard.com/pw/medium/066d5cb17d92ebcefee1fadeb6597f49.jpg" style="margin: 0; width: 100%;" alt="" />
<p style="font-size: 12px; margin: 0;">PikWizard</p>
</a>
</span>
</span>
Free (free of charge)
Free for personal and commercial use.
Author: Creative Art
Similar Free Stock Images

Premium


Premium


Premium


Premium


Premium


Premium


Premium


Premium


Premium


Premium


Premium


Premium


Premium


Premium


Premium


Premium


Premium


Premium


Premium


Premium


Premium


Premium


Premium


Premium