- Home >
- Stock Photos >
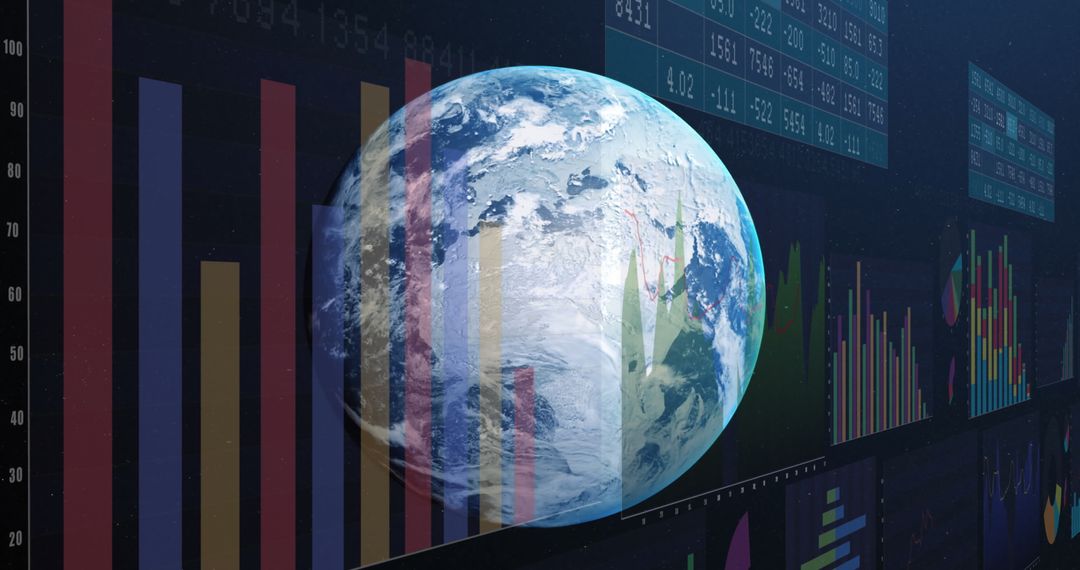
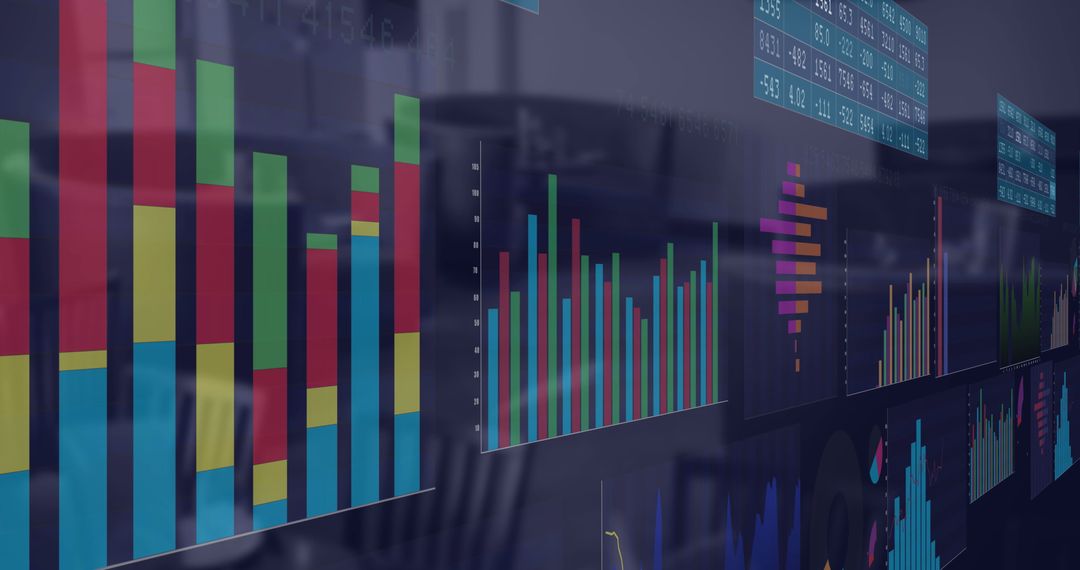
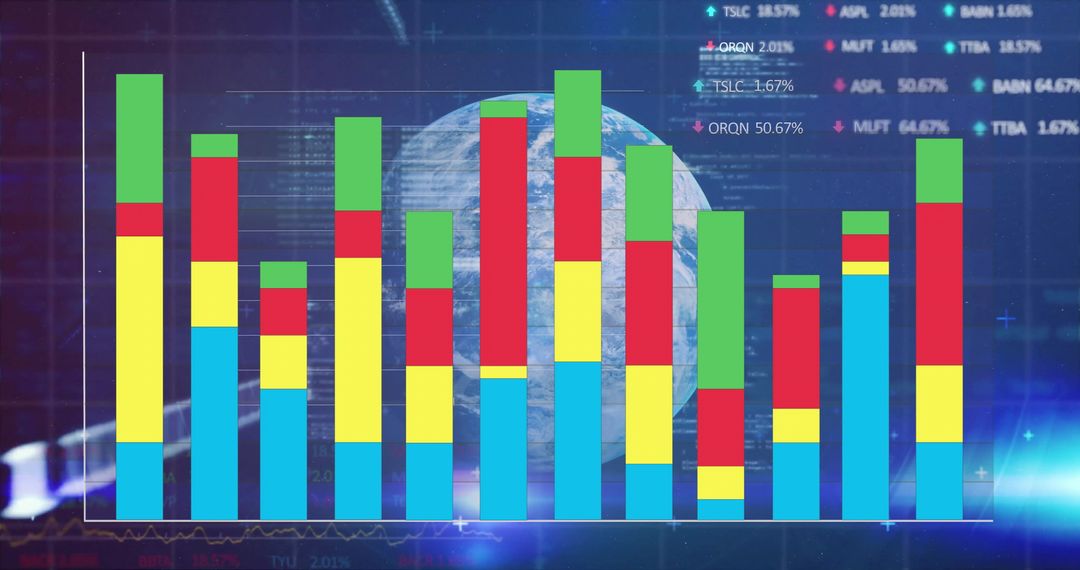
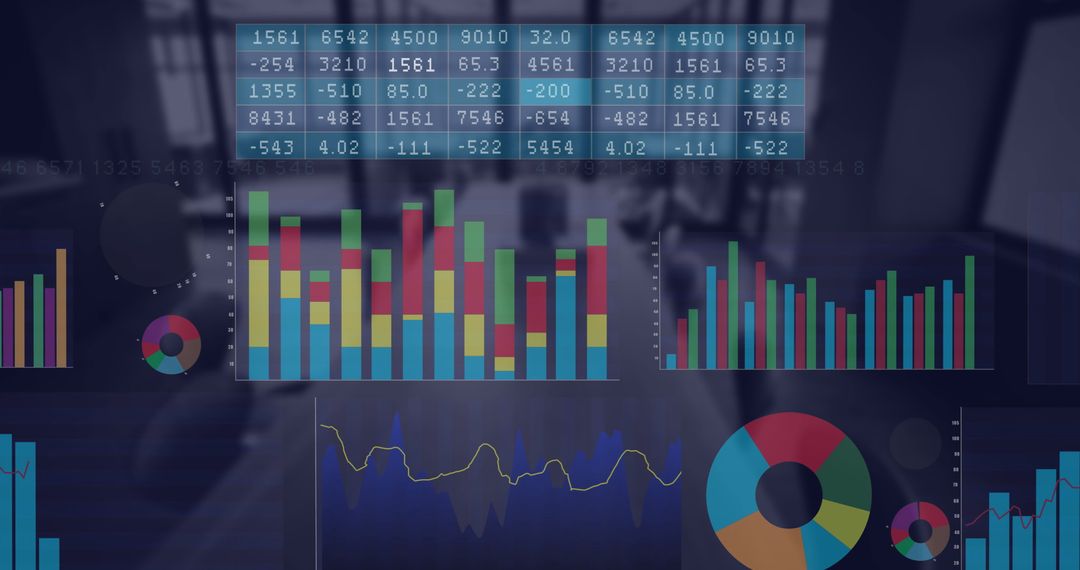
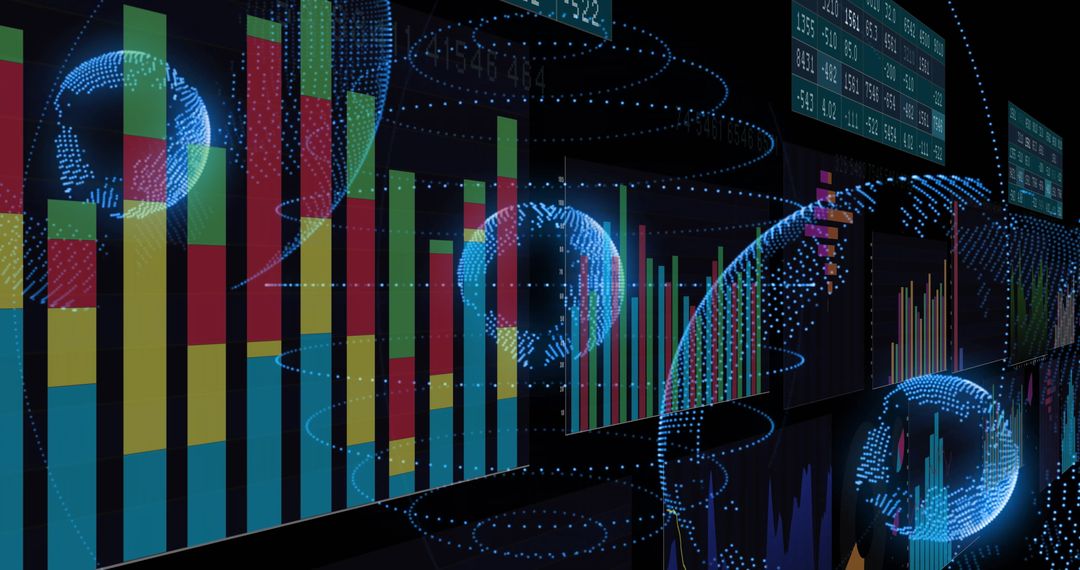
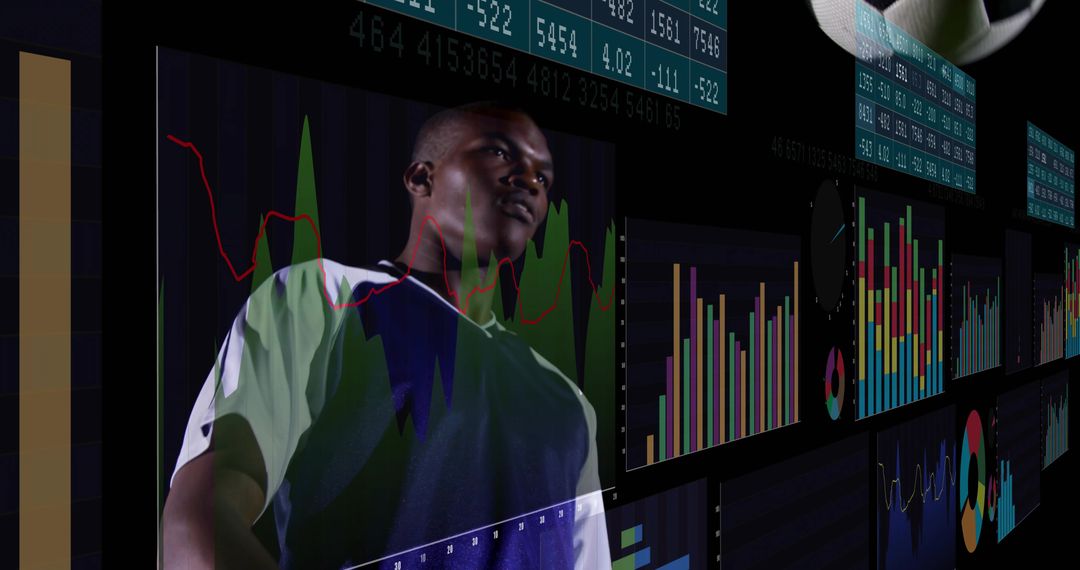
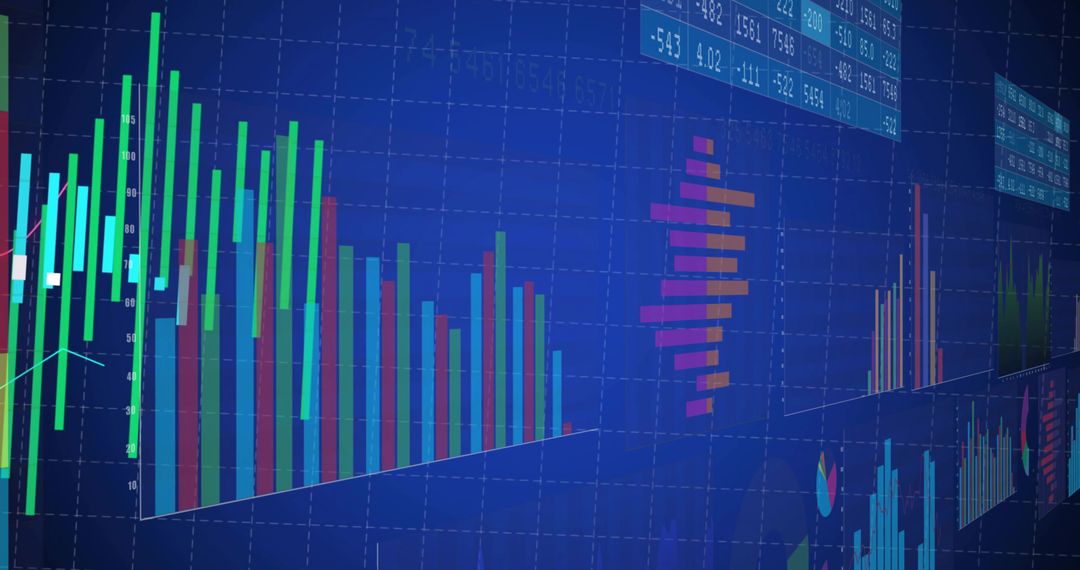
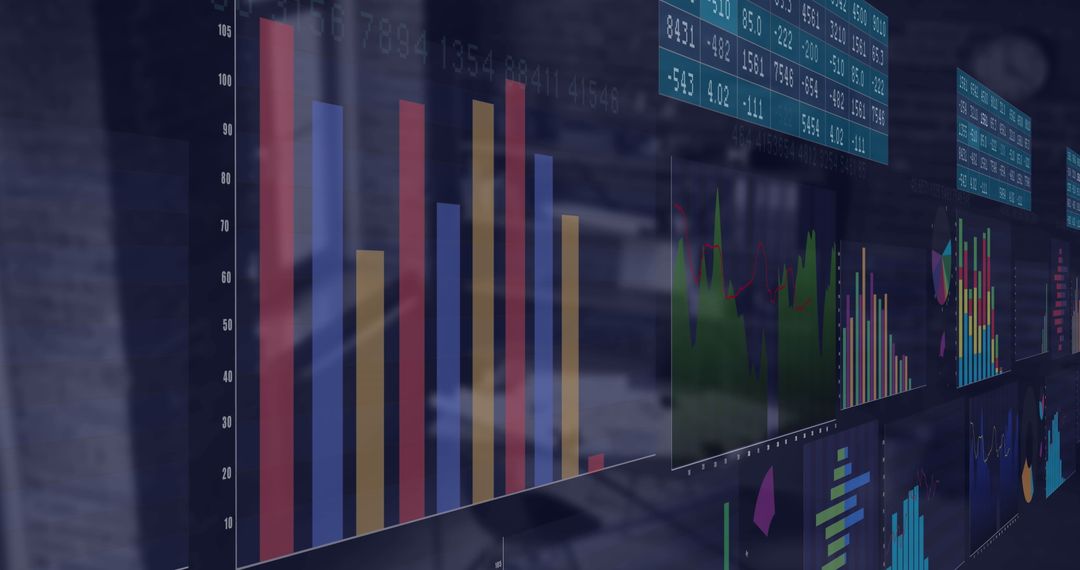
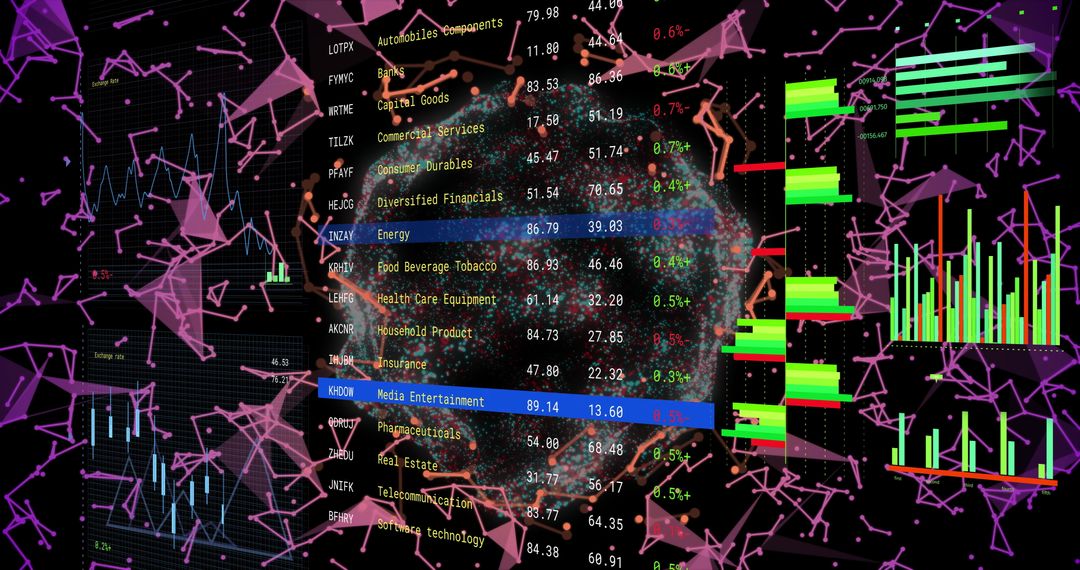
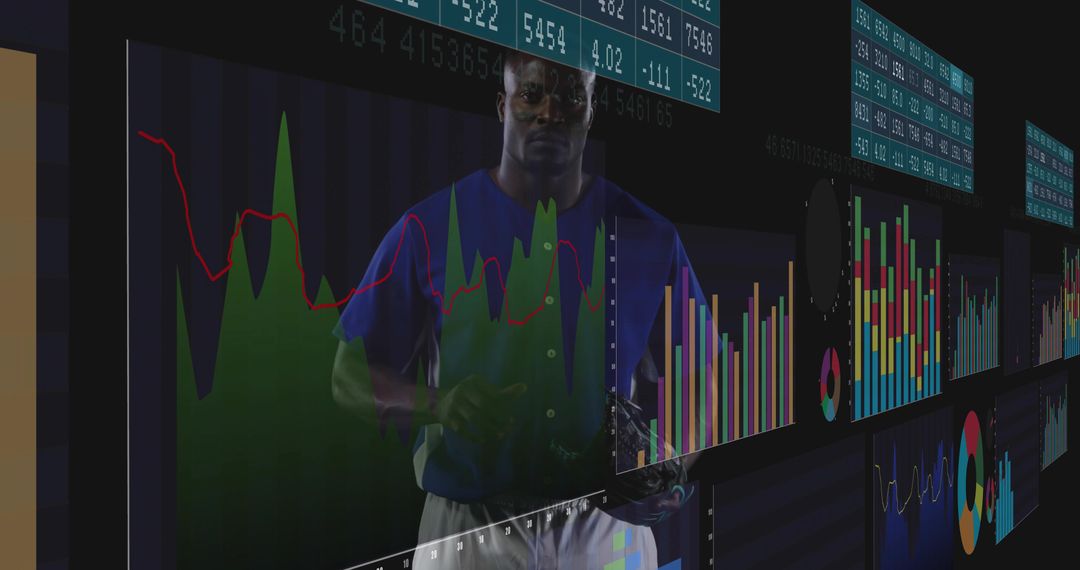
- Holographic Globe with Stacked Bar Charts on Digital Analytics Dashboard for Finance
Holographic Globe with Stacked Bar Charts on Digital Analytics Dashboard for Finance Image

Showing stacked multicolor bar charts layered over glowing holographic globe against dark analytics panels, conveying global data flow and comparative metrics. Perfect for illustrating global trends in finance, market research, business intelligence and fintech reporting. Offering high-contrast neon palette and multi-panel dashboard layout, delivering modern futuristic look for corporate presentations and digital branding. Working well for slide decks, investor pitch materials, website hero banners, dashboard UI mockups, editorial features, social media posts and marketing campaigns. Allowing space for overlay text, logos and data labels while maintaining visual clarity for complex datasets.
Powered by  - Get 15% off with code: PIKWIZARD15


0
downloads
downloads
Tags:
More
Credit Photo
If you would like to credit the Photo, here are some ways you can do so
Text Link
photo Link
<span class="text-link">
<span>
<a target="_blank" href=https://pikwizard.com/photo/holographic-globe-with-stacked-bar-charts-on-digital-analytics-dashboard-for-finance/cc35c9aecc1a9dafaf82a8e45ce7c2db/>PikWizard</a>
</span>
</span>
<span class="image-link">
<span
style="margin: 0 0 20px 0; display: inline-block; vertical-align: middle; width: 100%;"
>
<a
target="_blank"
href="https://pikwizard.com/photo/holographic-globe-with-stacked-bar-charts-on-digital-analytics-dashboard-for-finance/cc35c9aecc1a9dafaf82a8e45ce7c2db/"
style="text-decoration: none; font-size: 10px; margin: 0;"
>
<img src="https://pikwizard.com/pw/medium/cc35c9aecc1a9dafaf82a8e45ce7c2db.jpg" style="margin: 0; width: 100%;" alt="" />
<p style="font-size: 12px; margin: 0;">PikWizard</p>
</a>
</span>
</span>
Free (free of charge)
Free for personal and commercial use.
Author: Creative Art
Similar Free Stock Images
Premium


Premium


Premium


Premium


Premium


Premium


Premium


Premium


Premium


Premium


Premium