- Home >
- Stock Photos >
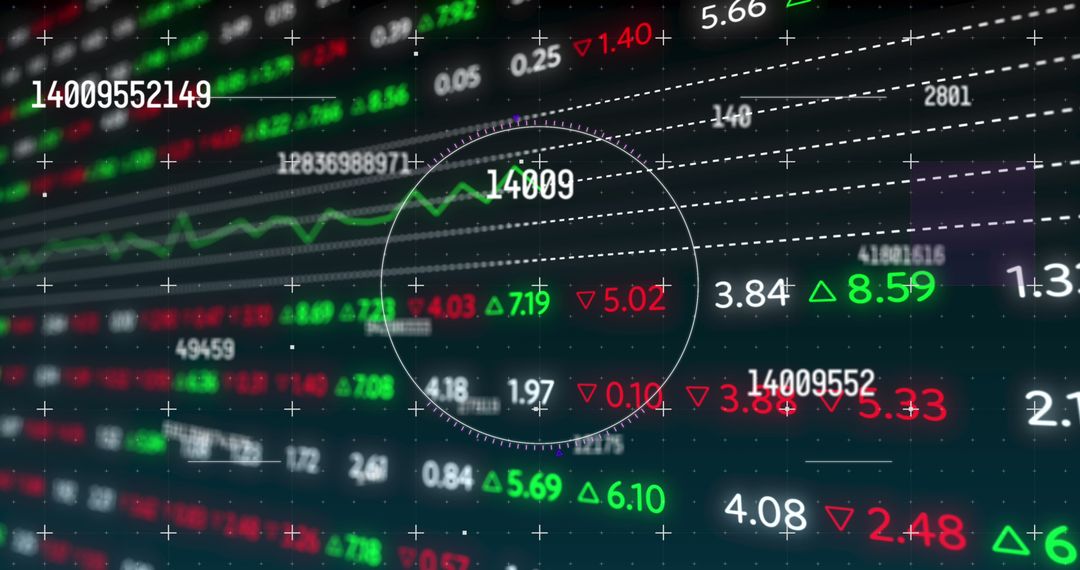
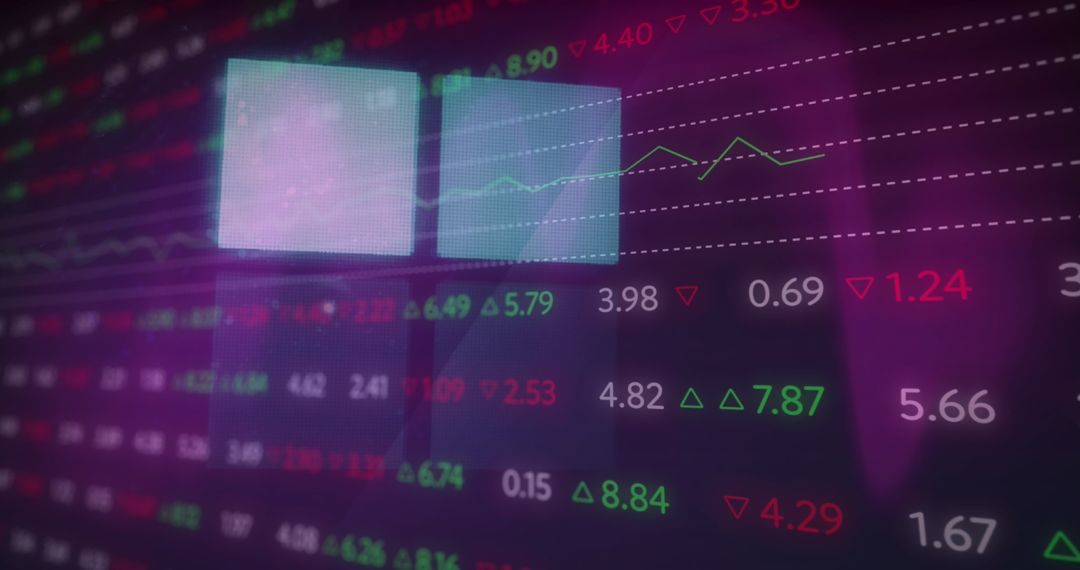
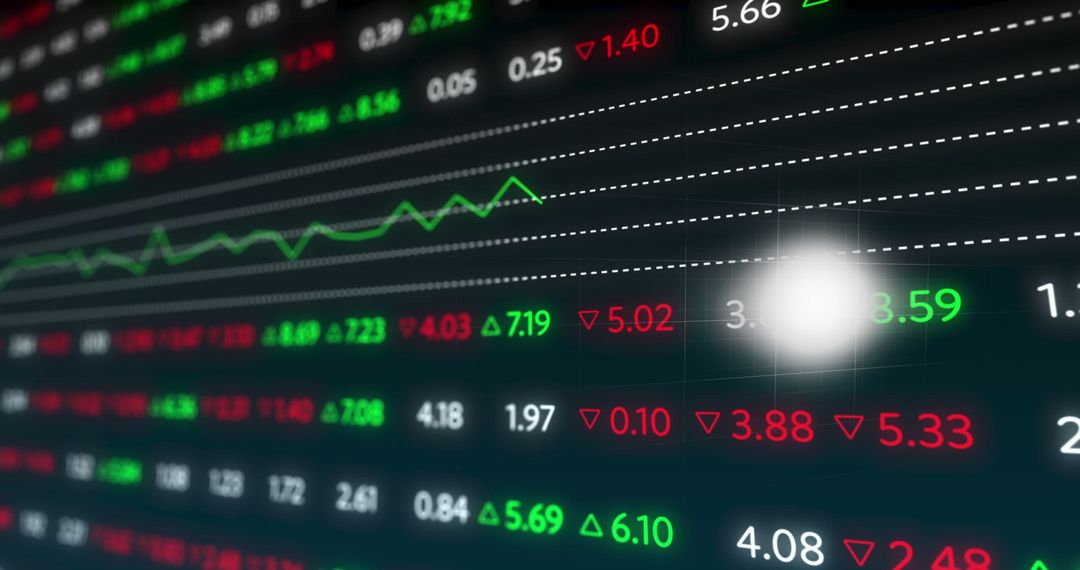
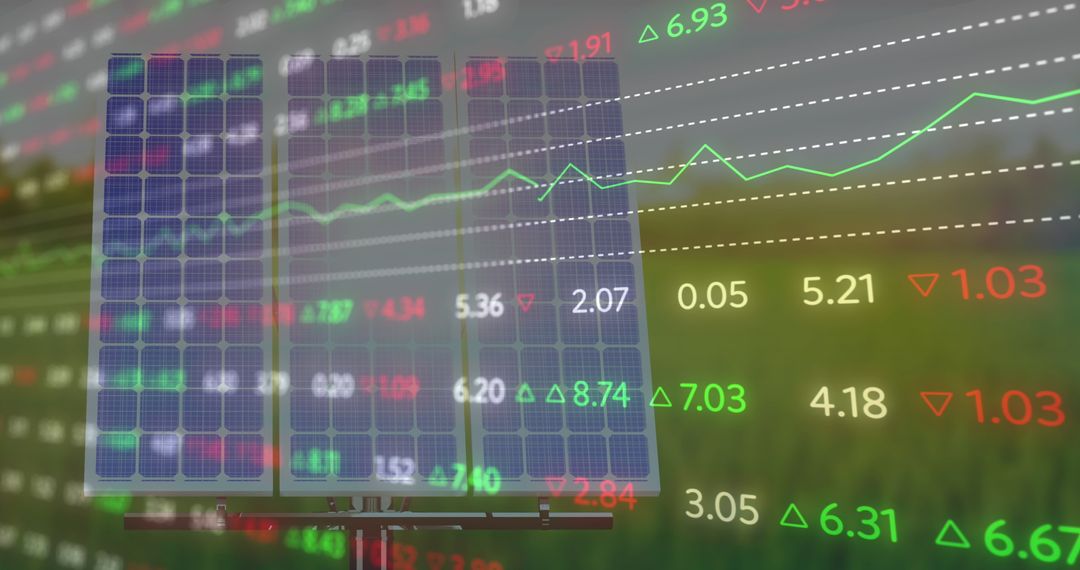
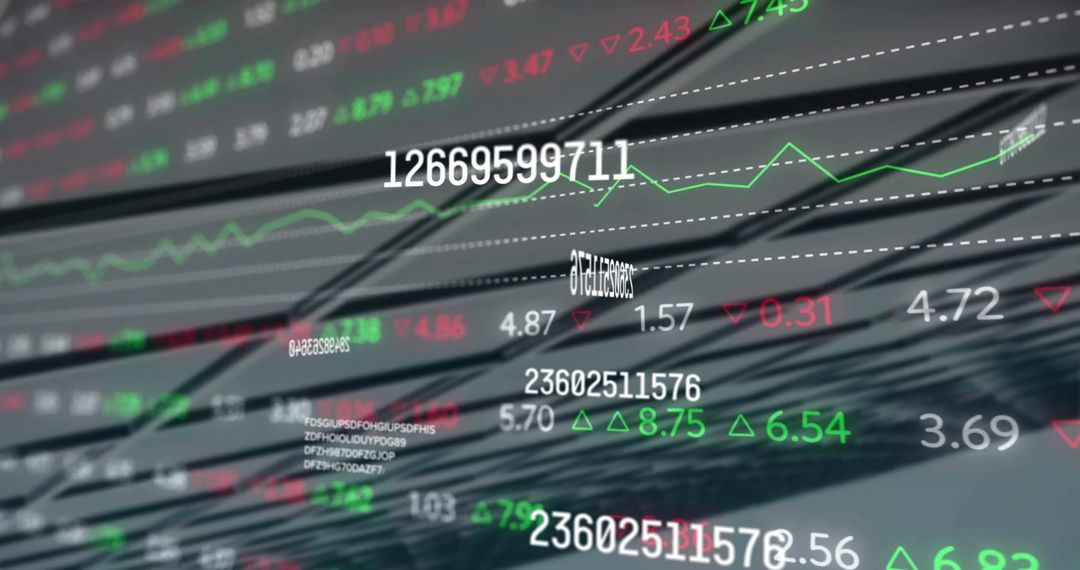
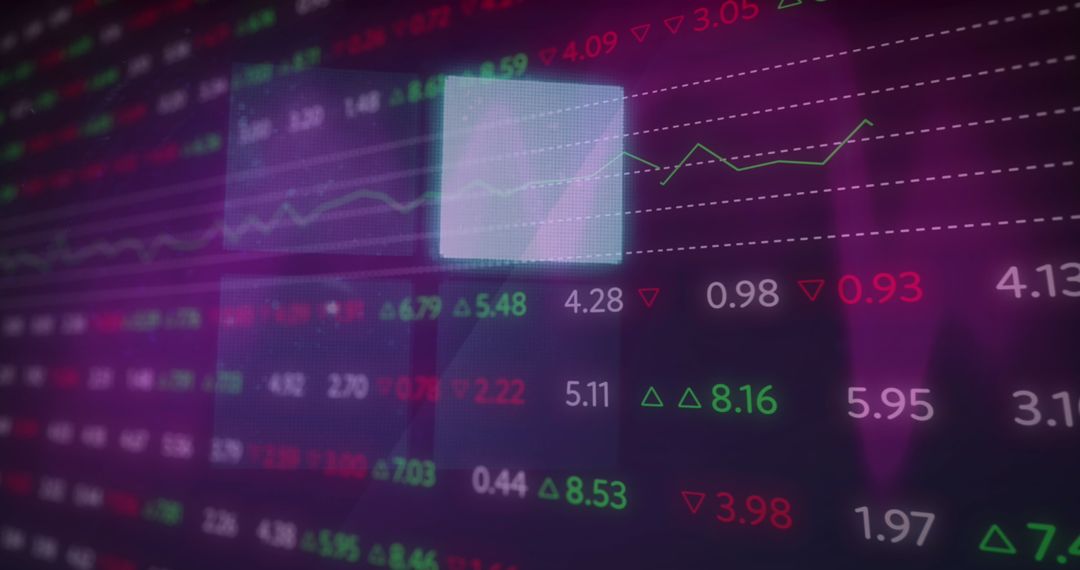
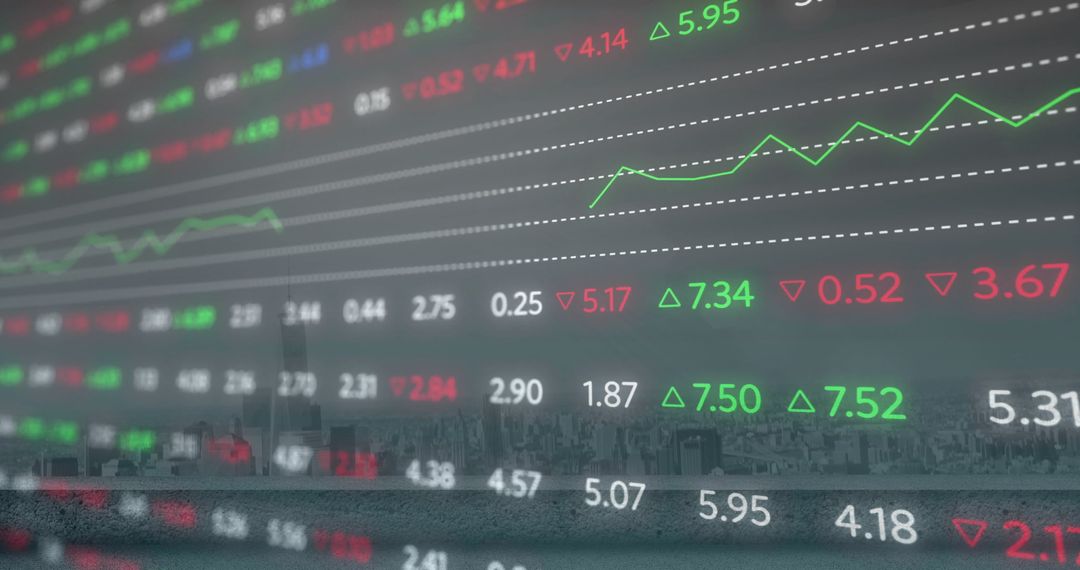
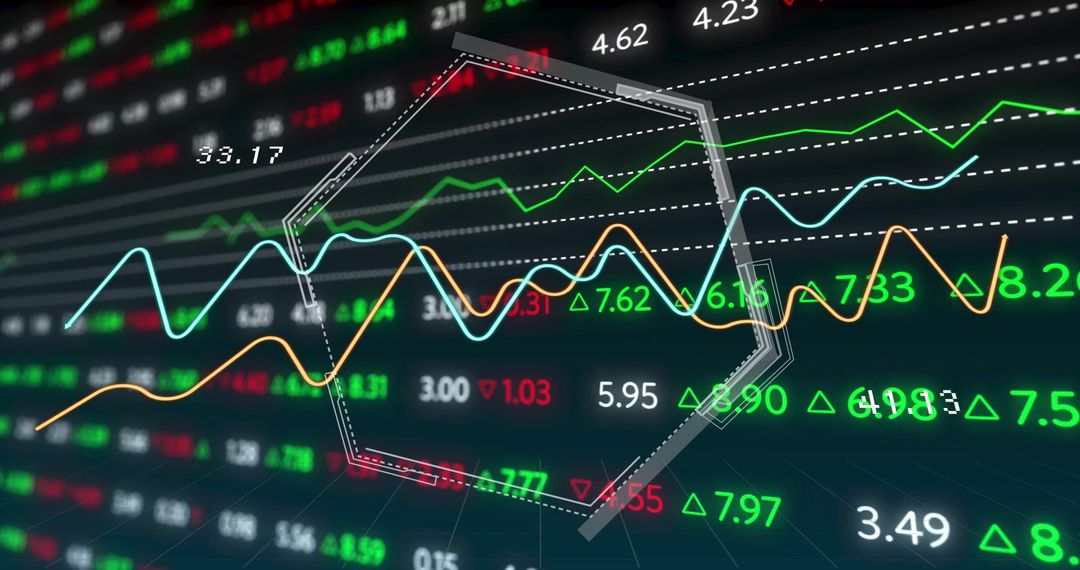
- Holographic Market Dashboard Showing Live Stock Tickers Neon Analytics Interface Line Charts
Holographic Market Dashboard Showing Live Stock Tickers Neon Analytics Interface Line Charts Image

Depicts layered holographic dashboard displaying live market tickers, numeric values, and trend lines in neon purple and teal. Interface elements are floating HUD panels, dotted trend bands, and glowing data points creating high-tech, futuristic atmosphere. Color palette focusing on magenta, purple, teal, and cyan with soft glow and motion blur for dynamic energy. Useful for fintech website hero, trading platform landing page, investor pitch deck, financial report cover, technology blog header, social media campaign, and presentation slides. Works well as background for UI mockups, promotional banners, webinar thumbnails, and infographics. Space available for headline, logo, and data overlays; combine with bold sans-serif typography and semi-transparent overlays for legible headlines. Recommended crops: wide banner (16:9) for hero headers, square (1:1) for social posts, tall (9:16) for mobile stories.
Powered by 


0
downloads
downloads
Tags:
More
Credit Photo
If you would like to credit the Photo, here are some ways you can do so
Text Link
photo Link
<span class="text-link">
<span>
<a target="_blank" href=https://pikwizard.com/photo/holographic-market-dashboard-showing-live-stock-tickers-neon-analytics-interface-line-charts/1ecd1b58359700e53e308b966ef226ce/>PikWizard</a>
</span>
</span>
<span class="image-link">
<span
style="margin: 0 0 20px 0; display: inline-block; vertical-align: middle; width: 100%;"
>
<a
target="_blank"
href="https://pikwizard.com/photo/holographic-market-dashboard-showing-live-stock-tickers-neon-analytics-interface-line-charts/1ecd1b58359700e53e308b966ef226ce/"
style="text-decoration: none; font-size: 10px; margin: 0;"
>
<img src="https://pikwizard.com/pw/medium/1ecd1b58359700e53e308b966ef226ce.jpg" style="margin: 0; width: 100%;" alt="" />
<p style="font-size: 12px; margin: 0;">PikWizard</p>
</a>
</span>
</span>
Free (free of charge)
Free for personal and commercial use.
Author: People Creations
Similar Free Stock Images

Premium


Premium


Premium


Premium


Premium


Premium


Premium


Premium


Premium


Premium


Premium


Premium


Premium


Premium


Premium


Premium


Premium


Premium


Premium


Premium


Premium


Premium


Premium

Premium