- Home >
- Stock Photos >
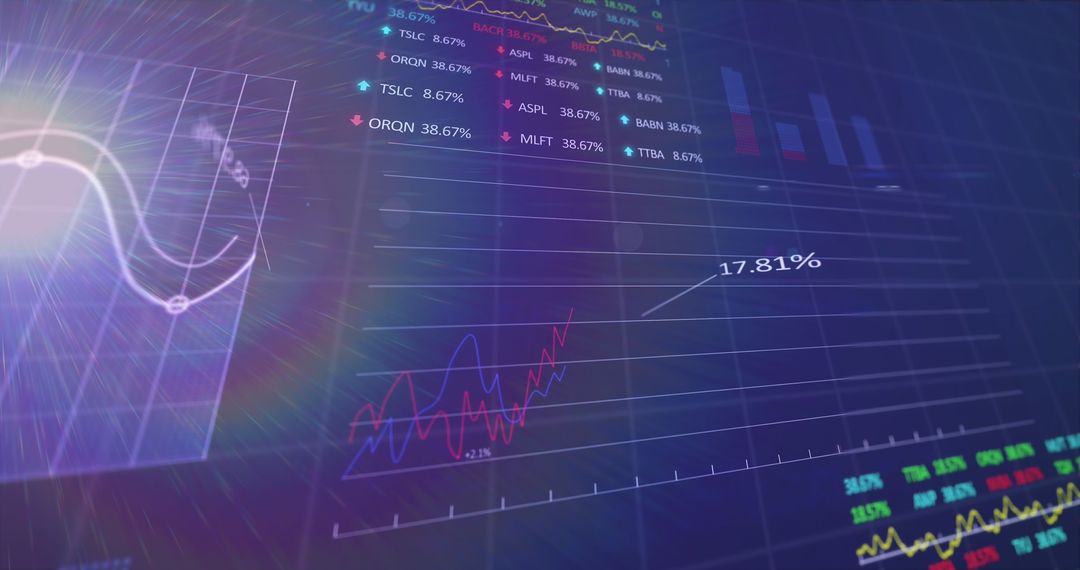
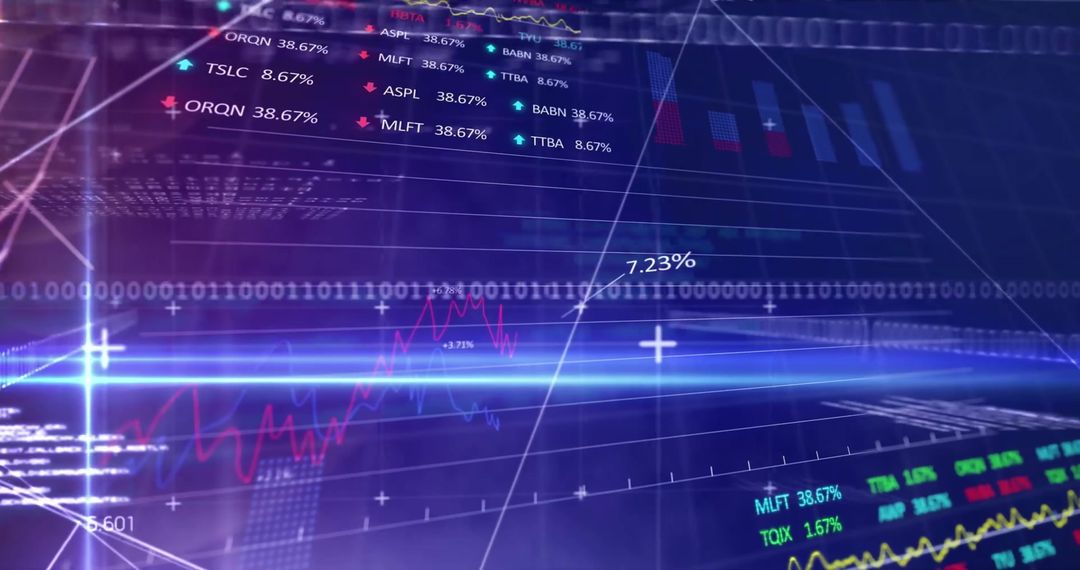
- Holographic Stock Data and Financial Analysis Interface
Holographic Stock Data and Financial Analysis Interface Image

Dynamic digital interface featuring holographic display of stock and financial data with technical charts, tickers, binary code, offering a modern take on digital finance technology. Companies selling fintech solutions or financial technology training programs can use it for promotional material. Financial news platforms and economists might use this for blogging, presentations, conferences, and analysis depiction.
Powered by  - Get 15% off with code: PIKWIZARD15


0
downloads
downloads
Tags:
More
Credit Photo
If you would like to credit the Photo, here are some ways you can do so
Text Link
photo Link
<span class="text-link">
<span>
<a target="_blank" href=https://pikwizard.com/photo/holographic-stock-data-and-financial-analysis-interface/0cbc59adfbbf5036157c95c65150563d/>PikWizard</a>
</span>
</span>
<span class="image-link">
<span
style="margin: 0 0 20px 0; display: inline-block; vertical-align: middle; width: 100%;"
>
<a
target="_blank"
href="https://pikwizard.com/photo/holographic-stock-data-and-financial-analysis-interface/0cbc59adfbbf5036157c95c65150563d/"
style="text-decoration: none; font-size: 10px; margin: 0;"
>
<img src="https://pikwizard.com/pw/medium/0cbc59adfbbf5036157c95c65150563d.jpg" style="margin: 0; width: 100%;" alt="" />
<p style="font-size: 12px; margin: 0;">PikWizard</p>
</a>
</span>
</span>
Free (free of charge)
Free for personal and commercial use.
Author: People Creations
Similar Free Stock Images

Premium


Premium


Premium


Premium


Premium


Premium


Premium


Premium


Premium


Premium


Premium


Premium