- Home >
- Stock Photos >
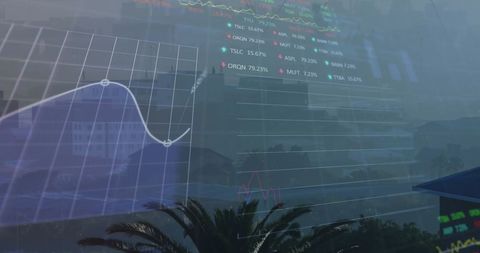
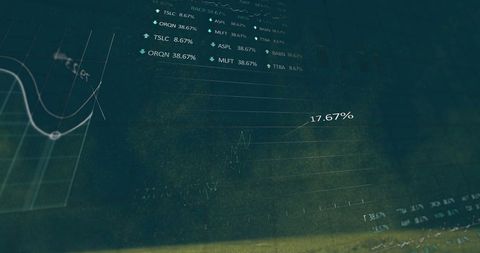
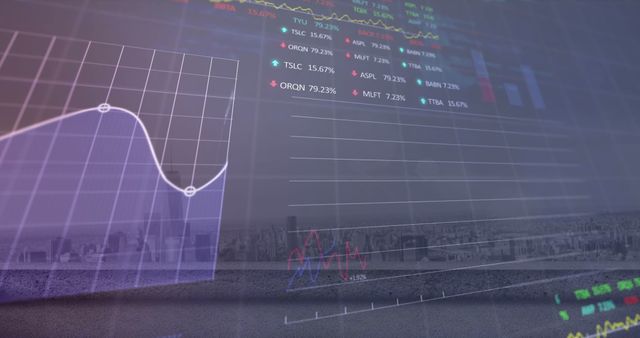
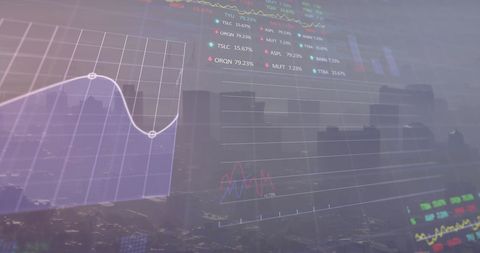
- Holographic Trading Console with Data Visuals and Coding Elements
Holographic Trading Console with Data Visuals and Coding Elements Image

The image depicts a futuristic holographic console combining elements of stock market trading visuals, coding symbols, and graphs against a black backdrop. This can be used for illustrating modern business analytics, financial analysis, or technology and data processing applications. Ideal for use in content about digital finance, investment strategies, or technological advancements in trading platforms.

downloads
Tags:
More
Credit Photo
If you would like to credit the Photo, here are some ways you can do so
Text Link
photo Link
<span class="text-link">
<span>
<a target="_blank" href=https://pikwizard.com/photo/holographic-trading-console-with-data-visuals-and-coding-elements/fa9ea41420c4d9efebbb40982ebb4f93/>PikWizard</a>
</span>
</span>
<span class="image-link">
<span
style="margin: 0 0 20px 0; display: inline-block; vertical-align: middle; width: 100%;"
>
<a
target="_blank"
href="https://pikwizard.com/photo/holographic-trading-console-with-data-visuals-and-coding-elements/fa9ea41420c4d9efebbb40982ebb4f93/"
style="text-decoration: none; font-size: 10px; margin: 0;"
>
<img src="https://pikwizard.com/pw/medium/fa9ea41420c4d9efebbb40982ebb4f93.jpg" style="margin: 0; width: 100%;" alt="" />
<p style="font-size: 12px; margin: 0;">PikWizard</p>
</a>
</span>
</span>
Free (free of charge)
Free for personal and commercial use.
Author: People Creations