- Home >
- Stock Photos >
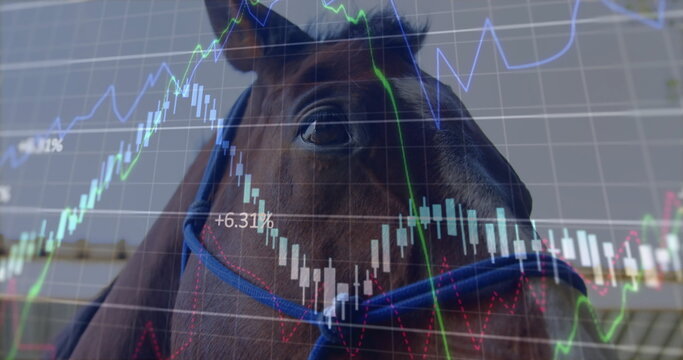
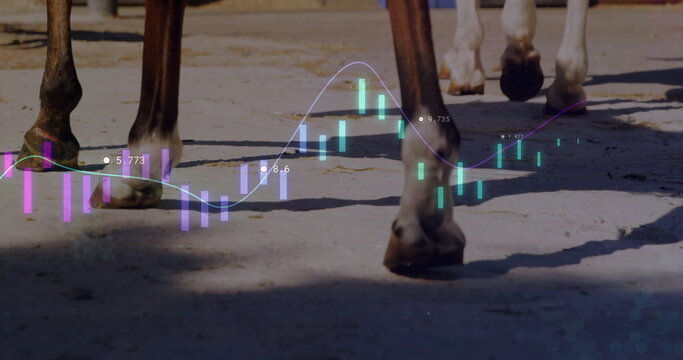
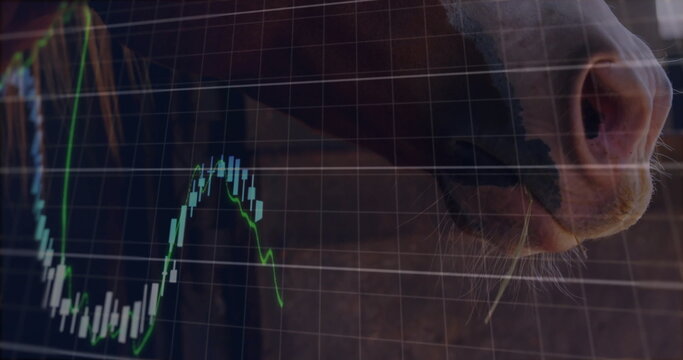
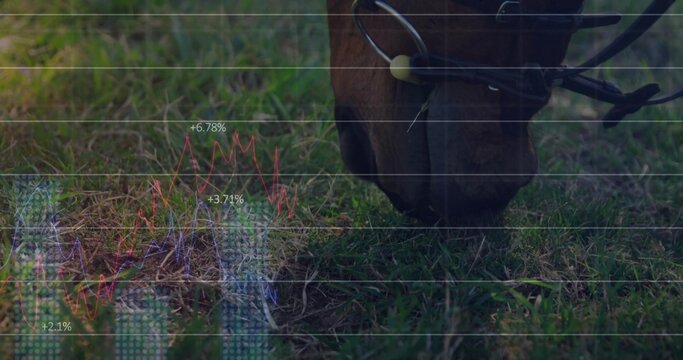
- Horse in Pasture with Overlaid Analytics Chart in Rural Scene
Horse in Pasture with Overlaid Analytics Chart in Rural Scene Image

Majestic horse standing beside fence post in sunlit pasture, with superimposed dynamic line chart. Represents themes of agriculture, statistics, equine management, and rural economy analysis. Useful for topics related to farming, data analysis, and animal husbandry in digital marketing or presentations.
Powered by 


0
downloads
downloads
Tags:
More
Credit Photo
If you would like to credit the Photo, here are some ways you can do so
Text Link
photo Link
<span class="text-link">
<span>
<a target="_blank" href=https://pikwizard.com/photo/horse-in-pasture-with-overlaid-analytics-chart-in-rural-scene/73a0b538d9d274dfb0ff8efd81552180/>PikWizard</a>
</span>
</span>
<span class="image-link">
<span
style="margin: 0 0 20px 0; display: inline-block; vertical-align: middle; width: 100%;"
>
<a
target="_blank"
href="https://pikwizard.com/photo/horse-in-pasture-with-overlaid-analytics-chart-in-rural-scene/73a0b538d9d274dfb0ff8efd81552180/"
style="text-decoration: none; font-size: 10px; margin: 0;"
>
<img src="https://pikwizard.com/pw/medium/73a0b538d9d274dfb0ff8efd81552180.jpg" style="margin: 0; width: 100%;" alt="" />
<p style="font-size: 12px; margin: 0;">PikWizard</p>
</a>
</span>
</span>
Free (free of charge)
Free for personal and commercial use.
Author: Awesome Content
Similar Free Stock Images

Premium


Premium


Premium


Premium


Premium


Premium


Premium


Premium


Premium


Premium


Premium


Premium


Premium


Premium


Premium


Premium


Premium


Premium


Premium


Premium


Premium


Premium


Premium


Premium