- Home >
- Stock Photos >
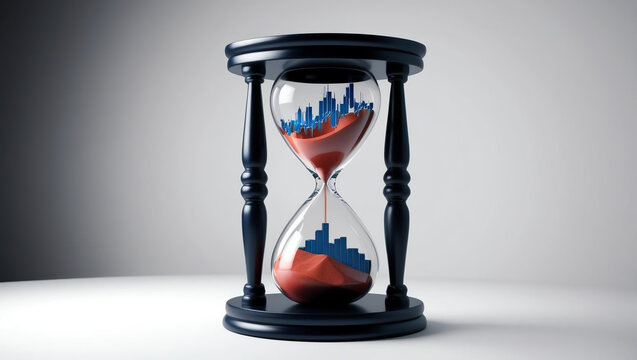
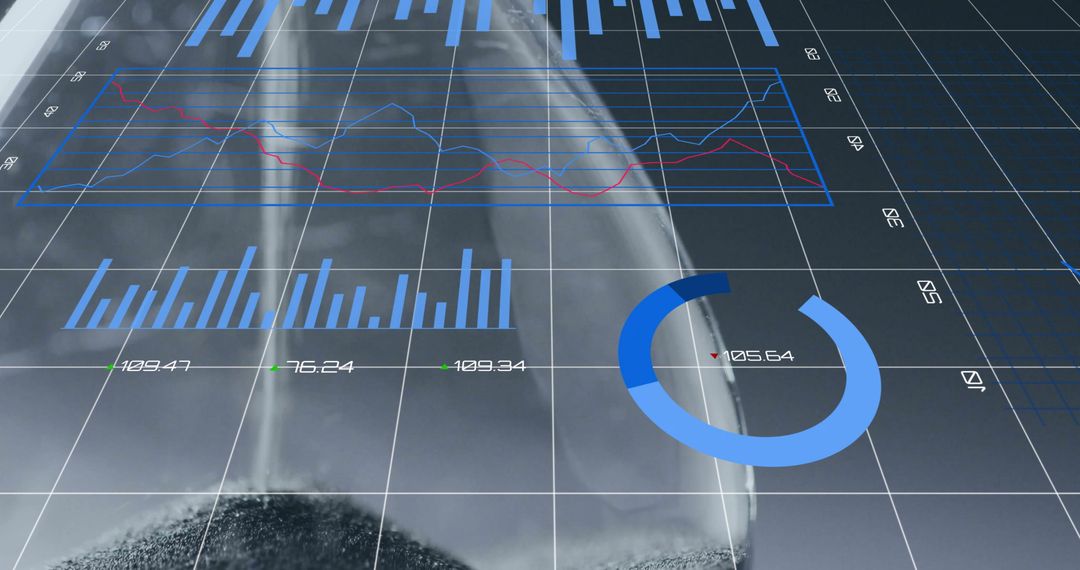
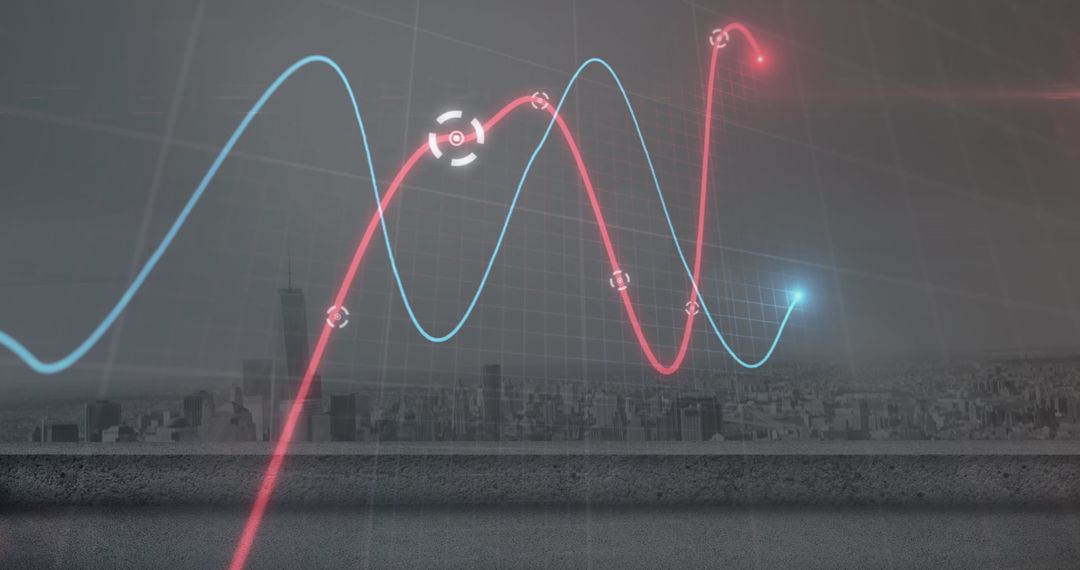
- Hourglass Symbolizing Time in Stock Market Data Analysis
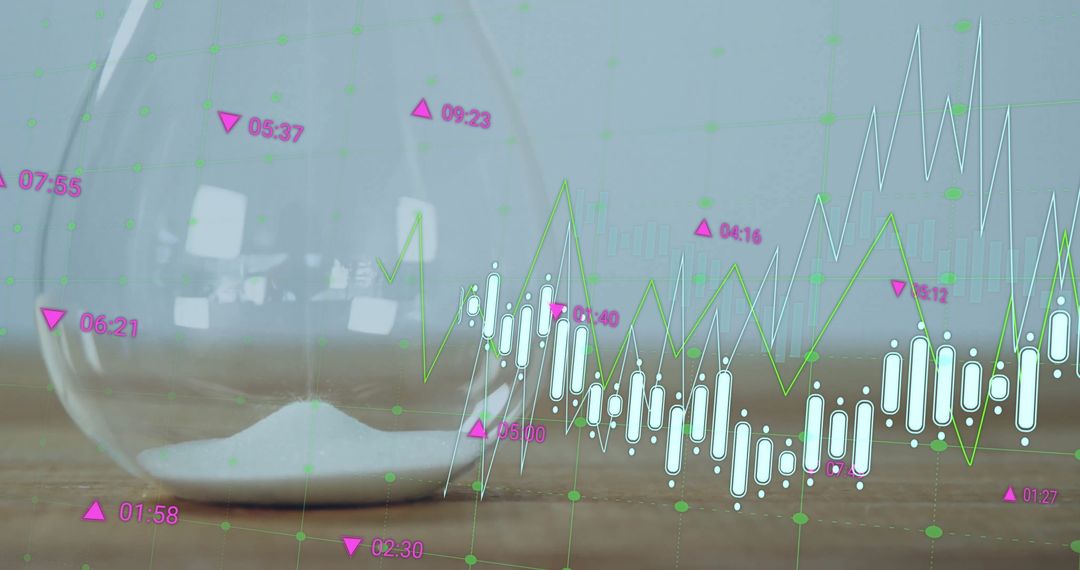
Hourglass Symbolizing Time in Stock Market Data Analysis Image
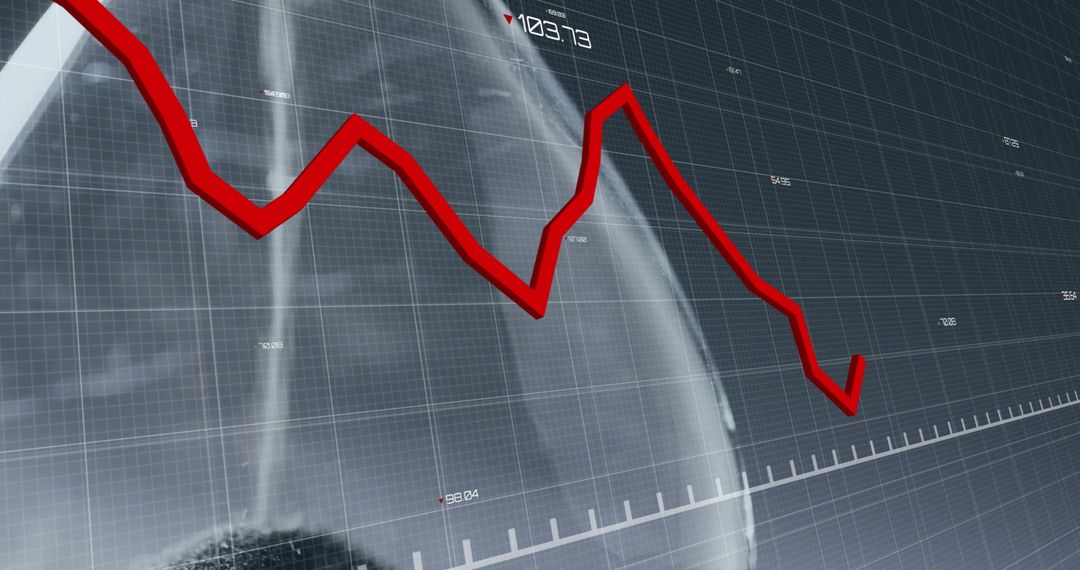
Hourglass filled with sand superimposed over graph with oscillating stock data lines in red and green. Represents conceptual merger between time management and financial market investment analysis. Ideal for illustrating concepts in finance blogs, presentations on market timing or investment strategies, or for use in financial planning and consultancy materials emphasizing patience and strategic investment over time.
Powered by 


2
downloads
downloads
Tags:
More
Credit Photo
If you would like to credit the Photo, here are some ways you can do so
Text Link
photo Link
<span class="text-link">
<span>
<a target="_blank" href=https://pikwizard.com/photo/hourglass-symbolizing-time-in-stock-market-data-analysis/a67b7b4b408750c95981f396082936fb/>PikWizard</a>
</span>
</span>
<span class="image-link">
<span
style="margin: 0 0 20px 0; display: inline-block; vertical-align: middle; width: 100%;"
>
<a
target="_blank"
href="https://pikwizard.com/photo/hourglass-symbolizing-time-in-stock-market-data-analysis/a67b7b4b408750c95981f396082936fb/"
style="text-decoration: none; font-size: 10px; margin: 0;"
>
<img src="https://pikwizard.com/pw/medium/a67b7b4b408750c95981f396082936fb.jpg" style="margin: 0; width: 100%;" alt="" />
<p style="font-size: 12px; margin: 0;">PikWizard</p>
</a>
</span>
</span>
Free (free of charge)
Free for personal and commercial use.
Author: Authentic Images
Similar Free Stock Images

Premium


Premium


Premium


Premium


Premium


Premium


Premium


Premium


Premium


Premium


Premium


Premium

Premium


Premium


Premium


Premium


Premium


Premium


Premium


Premium


Premium


Premium