
- Home >
- Free Stock Photos & Images >
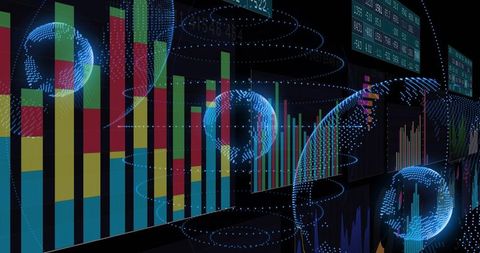
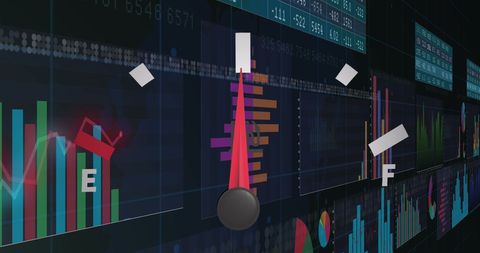
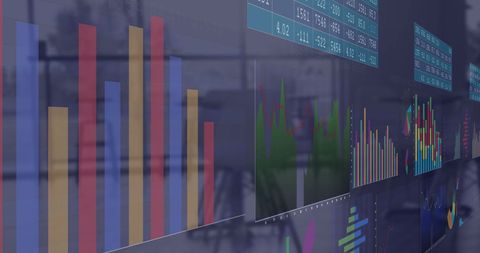
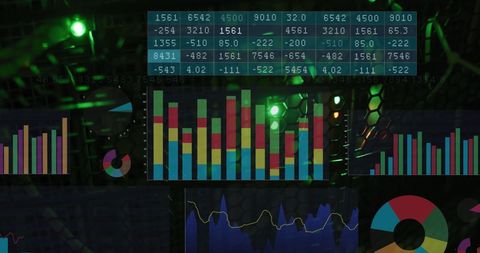
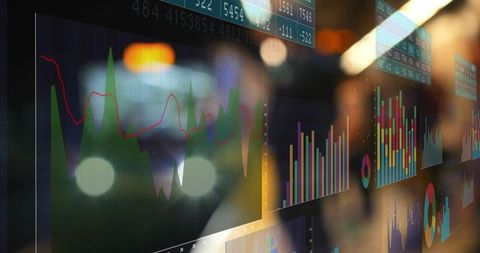
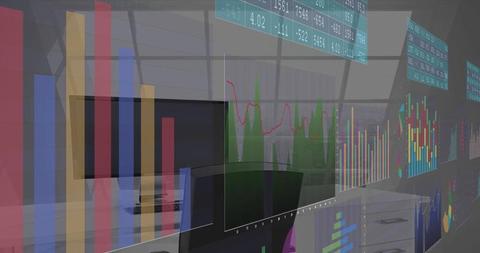
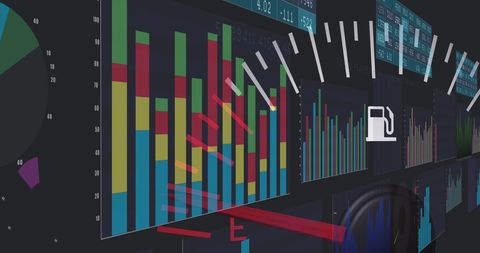
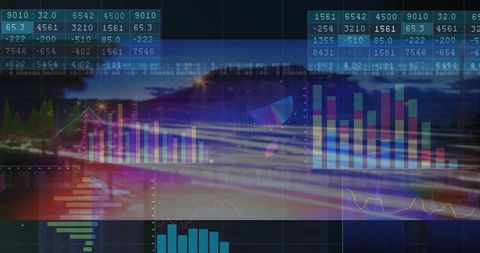
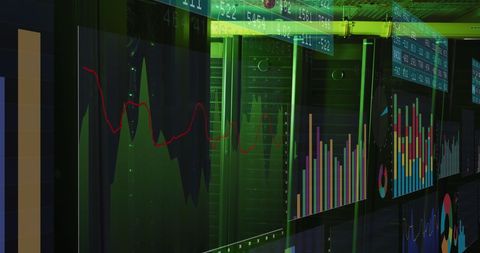
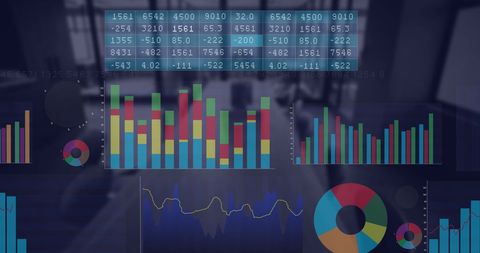
- Illuminated Dashboard Panels Visualizing Financial, Operational and KPI Analytics
Illuminated Dashboard Panels Visualizing Financial, Operational and KPI Analytics Free Stock Image
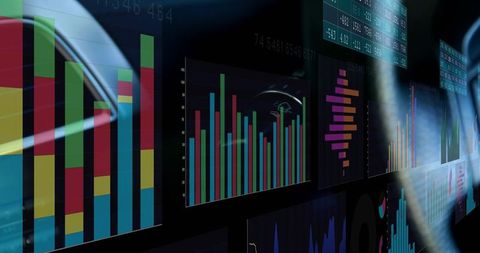
Showing dark control room wall of illuminated LED panels presenting colorful grouped and stacked vertical bar charts, horizontal bar chart, and numeric tickers. Featuring neon reflections and glossy surfaces for high-tech, futuristic atmosphere. Using blue, green, red and yellow palettes with line overlays and histogram elements to convey complex finance and operations data. Ideal for corporate presentations, fintech websites, analytics platform marketing, investor reports, and editorial articles about data-driven decision making. Working well as hero header, slide background, blog banner, social media campaign, annual report cover, or product landing page backdrop. Providing strong visual cues for KPI tracking, real-time monitoring, performance benchmarking and trading floor concepts; recommending overlay text in high-contrast color and cropping for wide hero layouts.
Powered by  - Get 15% off with code: PIKWIZARD15


downloads
Tags:
More
Credit Photo
If you would like to credit the Photo, here are some ways you can do so
Text Link
photo Link
<span class="text-link">
<span>
<a target="_blank" href=https://pikwizard.com/photo/illuminated-dashboard-panels-visualizing-financial-operational-and-kpi-analytics/10e7f713e9a51d0f291dd43a002c3fa6/>PikWizard</a>
</span>
</span>
<span class="image-link">
<span
style="margin: 0 0 20px 0; display: inline-block; vertical-align: middle; width: 100%;"
>
<a
target="_blank"
href="https://pikwizard.com/photo/illuminated-dashboard-panels-visualizing-financial-operational-and-kpi-analytics/10e7f713e9a51d0f291dd43a002c3fa6/"
style="text-decoration: none; font-size: 10px; margin: 0;"
>
<img src="https://thumbs.wbm.im/pw/medium/10e7f713e9a51d0f291dd43a002c3fa6.jpg" style="margin: 0; width: 100%;" alt="Illuminated Dashboard Panels Visualizing Financial, Operational and KPI Analytics" />
<p style="font-size: 12px; margin: 0;">PikWizard</p>
</a>
</span>
</span>
Free (free of charge)
Free for personal and commercial use.
Author: Awesome Content
Similar Free Stock Images


Premium


Premium


Premium


Premium


Premium


Premium


Premium


Premium


Premium


Premium


Premium


Premium


AI


Premium


Premium


Premium


Premium


Premium


Premium


Premium


Premium


Premium


Premium


Premium


Premium


Premium

Explore More Free Stock Images