
- Home >
- Stock Photos >
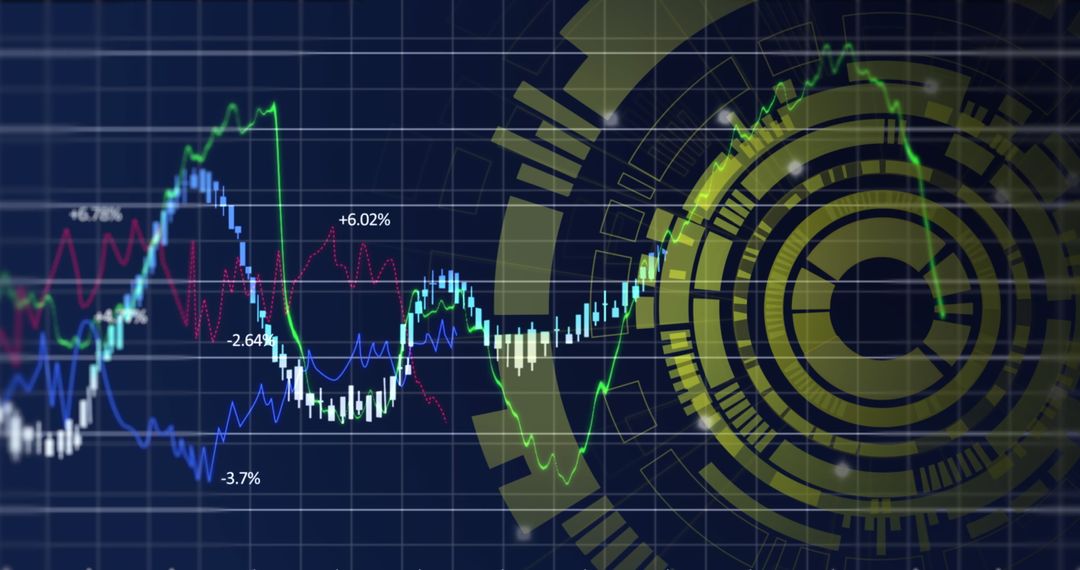
- Illuminated Financial Data Chart Display on Dark Backdrop
Illuminated Financial Data Chart Display on Dark Backdrop Image

Depicts digital financial data representation with rising and falling line and bar charts on dark background, suggesting dynamic stock market activity. Ideal for use in discussions of finance, business analytics presentations, economic news articles, or investment strategy workshops, conveying dynamic movement and modernity.
Powered by  - Get 15% off with code: PIKWIZARD15


2
downloads
downloads
Tags:
More
Credit Photo
If you would like to credit the Photo, here are some ways you can do so
Text Link
photo Link
<span class="text-link">
<span>
<a target="_blank" href=https://pikwizard.com/photo/illuminated-financial-data-chart-display-on-dark-backdrop/96179981ed40d1182970be1f50dba0b1/>PikWizard</a>
</span>
</span>
<span class="image-link">
<span
style="margin: 0 0 20px 0; display: inline-block; vertical-align: middle; width: 100%;"
>
<a
target="_blank"
href="https://pikwizard.com/photo/illuminated-financial-data-chart-display-on-dark-backdrop/96179981ed40d1182970be1f50dba0b1/"
style="text-decoration: none; font-size: 10px; margin: 0;"
>
<img src="https://pikwizard.com/pw/medium/96179981ed40d1182970be1f50dba0b1.jpg" style="margin: 0; width: 100%;" alt="" />
<p style="font-size: 12px; margin: 0;">PikWizard</p>
</a>
</span>
</span>
Free (free of charge)
Free for personal and commercial use.
Author: Creative Art
Similar Free Stock Images

Premium


Premium


Premium


Premium


Premium


Premium


Premium


Premium


Premium


Premium


Premium


Premium


Premium


Premium


Premium


Premium


Premium


Premium


Premium


Premium


Premium


Premium


Premium


Premium

