
- Home >
- Stock Photos >
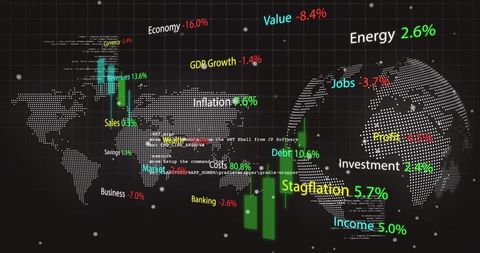
- Illustrated Financial Data Analysis on Dynamic Graph
Illustrated Financial Data Analysis on Dynamic Graph Image

This illustration captures various financial metrics such as inflation, GDP growth, and banking, using dynamic graphs and numerical values. Perfect for articles or presentations on economics, business reportage, or finance education, it vividly depicts complexities in data processing.
Powered by 


downloads
Tags:
More
Credit Photo
If you would like to credit the Photo, here are some ways you can do so
Text Link
photo Link
<span class="text-link">
<span>
<a target="_blank" href=https://pikwizard.com/photo/illustrated-financial-data-analysis-on-dynamic-graph/e16498dc65a86a06f7daad5dcf849114/>PikWizard</a>
</span>
</span>
<span class="image-link">
<span
style="margin: 0 0 20px 0; display: inline-block; vertical-align: middle; width: 100%;"
>
<a
target="_blank"
href="https://pikwizard.com/photo/illustrated-financial-data-analysis-on-dynamic-graph/e16498dc65a86a06f7daad5dcf849114/"
style="text-decoration: none; font-size: 10px; margin: 0;"
>
<img src="https://pikwizard.com/pw/medium/e16498dc65a86a06f7daad5dcf849114.jpg" style="margin: 0; width: 100%;" alt="" />
<p style="font-size: 12px; margin: 0;">PikWizard</p>
</a>
</span>
</span>
Free (free of charge)
Free for personal and commercial use.
Author: Authentic Images
Similar Free Stock Images

Premium


Premium


Premium


Premium


Premium


Premium

Premium


Premium


Premium


Premium

Premium


Premium


Premium

Premium


Premium


Premium


Premium


Premium


Premium


Premium


Premium


Premium


Premium


Premium

Premium


Explore More Free Stock Images