- Home >
- Stock Photos >
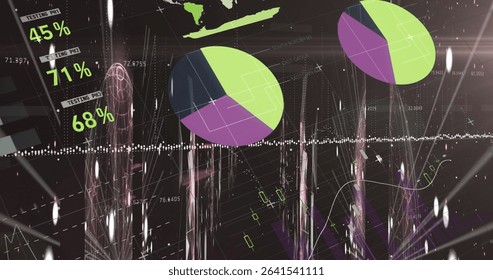
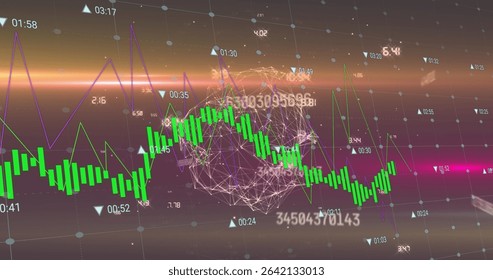
- Immersive 3D Virtual Charts with Mathematical Overlays
Immersive 3D Virtual Charts with Mathematical Overlays Image

Dynamic representation of 3D bar and candlestick charts integrated into a futuristic virtual dashboard with mathematical notations overlay. Ideal for use in presentations about advanced analytics, data science, or holographic technology projects. Perfect for conveying complex information in a visually engaging format. Can be used in educational materials focusing on virtual data representations.
Powered by  - Get 15% off with code: PIKWIZARD15


2
downloads
downloads
Tags:
More
Credit Photo
If you would like to credit the Photo, here are some ways you can do so
Text Link
photo Link
<span class="text-link">
<span>
<a target="_blank" href=https://pikwizard.com/photo/immersive-3d-virtual-charts-with-mathematical-overlays/1f55ff04d1e359238661c897389c2820/>PikWizard</a>
</span>
</span>
<span class="image-link">
<span
style="margin: 0 0 20px 0; display: inline-block; vertical-align: middle; width: 100%;"
>
<a
target="_blank"
href="https://pikwizard.com/photo/immersive-3d-virtual-charts-with-mathematical-overlays/1f55ff04d1e359238661c897389c2820/"
style="text-decoration: none; font-size: 10px; margin: 0;"
>
<img src="https://pikwizard.com/pw/medium/1f55ff04d1e359238661c897389c2820.jpg" style="margin: 0; width: 100%;" alt="" />
<p style="font-size: 12px; margin: 0;">PikWizard</p>
</a>
</span>
</span>
Free (free of charge)
Free for personal and commercial use.
Author: People Creations
Similar Free Stock Images

Premium


Premium


Premium


Premium


Premium


Premium


Premium


Premium