
- Home >
- Free Stock Photos & Images >
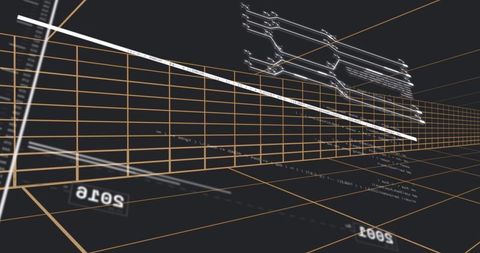
- Incoming data pulse streaming through dashboard grid with dynamic dot-matrix overlays
Incoming data pulse streaming through dashboard grid with dynamic dot-matrix overlays Free Stock Image
Showing futuristic dashboard grid with layered transparent panels, numeric readouts, dot-matrix blocks and line charts, creating strong sense of depth and motion. Featuring blue guide lines on dark canvas to enhance contrast and focus on data elements. Composing multiple overlay windows and code-like text to convey real-time monitoring, analytics and system telemetry. Ideal for technology website headers, data analytics presentations, cybersecurity reports, SaaS product pages, startup pitch decks, app UI mockups, editorial content on AI and big data, motion graphics and broadcast overlays. Working well as hero background with bold headline, supporting visual for white papers and infographics, or subtle animated loop for product demos. Providing clear areas for overlaying text or logos by using darker margins and simplified panels.
Powered by  - Get 15% off with code: PIKWIZARD15


downloads
Tags:
More
Credit Photo
If you would like to credit the Photo, here are some ways you can do so
Text Link
photo Link
<span class="text-link">
<span>
<a target="_blank" href=https://pikwizard.com/photo/incoming-data-pulse-streaming-through-dashboard-grid-with-dynamic-dot-matrix-overlays/fe260da8f6fa0aeb8eee099b25c27d03/>PikWizard</a>
</span>
</span>
<span class="image-link">
<span
style="margin: 0 0 20px 0; display: inline-block; vertical-align: middle; width: 100%;"
>
<a
target="_blank"
href="https://pikwizard.com/photo/incoming-data-pulse-streaming-through-dashboard-grid-with-dynamic-dot-matrix-overlays/fe260da8f6fa0aeb8eee099b25c27d03/"
style="text-decoration: none; font-size: 10px; margin: 0;"
>
<img src="https://thumbs.wbm.im/pw/medium/fe260da8f6fa0aeb8eee099b25c27d03.jpg" style="margin: 0; width: 100%;" alt="Incoming data pulse streaming through dashboard grid with dynamic dot-matrix overlays" />
<p style="font-size: 12px; margin: 0;">PikWizard</p>
</a>
</span>
</span>
Free (free of charge)
Free for personal and commercial use.
Author: People Creations
Similar Free Stock Images


Premium


Premium


Premium


Premium


Premium


Premium


Premium


Premium


Premium


Premium


Premium


Premium


Premium


Premium


Premium


Premium


Premium


Premium


Premium


Premium


Premium


Premium


Premium


Premium


Premium

Explore More Free Stock Images