
- Home >
- Stock Photos >
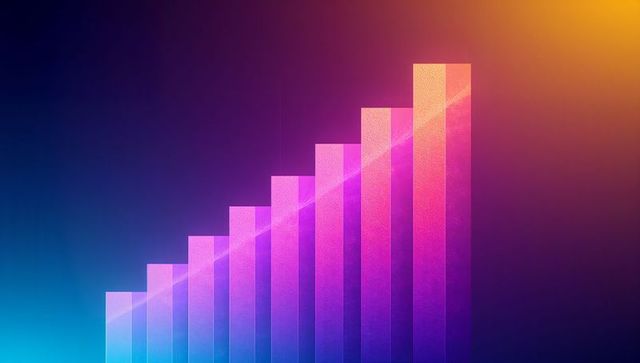
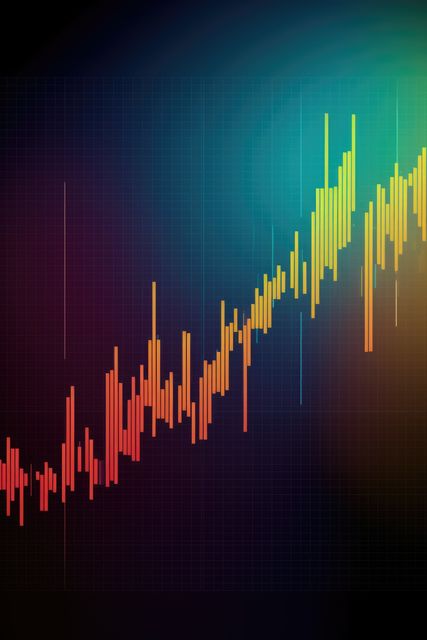
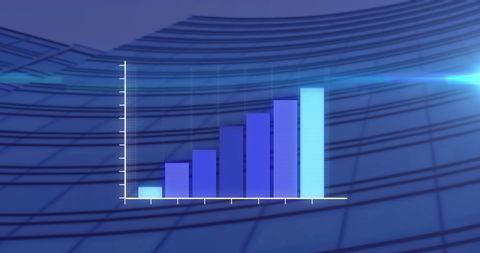
- Increasing Data Bar Chart on Gradient Background
Increasing Data Bar Chart on Gradient Background Image

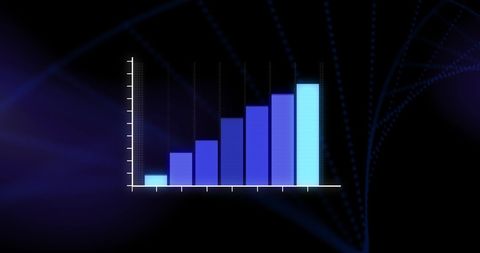
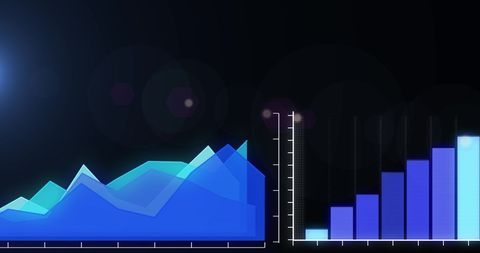
Stylized bar chart with upward trendset on dark gradient convenient for business and analytics documents. Ideal for presentations, financial reports, corporate slides, demonstrating statistics, showcasing data growth dynamics.

downloads
Tags:
More
Credit Photo
If you would like to credit the Photo, here are some ways you can do so
Text Link
photo Link
<span class="text-link">
<span>
<a target="_blank" href=https://pikwizard.com/photo/increasing-data-bar-chart-on-gradient-background/1c90e3293af07c71eb5da426e3084f3b/>PikWizard</a>
</span>
</span>
<span class="image-link">
<span
style="margin: 0 0 20px 0; display: inline-block; vertical-align: middle; width: 100%;"
>
<a
target="_blank"
href="https://pikwizard.com/photo/increasing-data-bar-chart-on-gradient-background/1c90e3293af07c71eb5da426e3084f3b/"
style="text-decoration: none; font-size: 10px; margin: 0;"
>
<img src="https://pikwizard.com/pw/medium/1c90e3293af07c71eb5da426e3084f3b.jpg" style="margin: 0; width: 100%;" alt="" />
<p style="font-size: 12px; margin: 0;">PikWizard</p>
</a>
</span>
</span>
Free (free of charge)
Free for personal and commercial use.
Author: Authentic Images
Similar Free Stock Images


AI


AI


AI

AI


Explore More Free Stock Images