
- Home >
- Stock Photos >
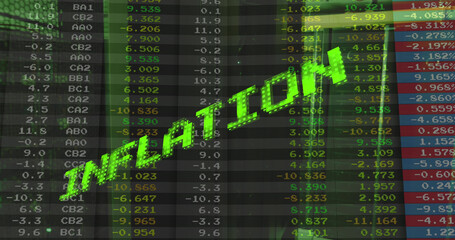
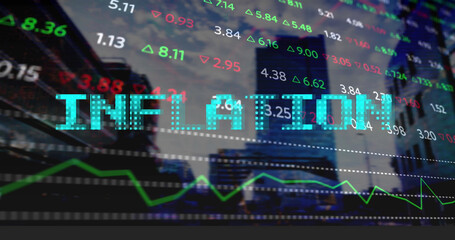
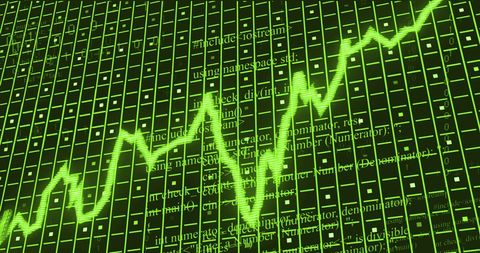
- Inflation Graph with Data Code Overlay on Digital Screen
Inflation Graph with Data Code Overlay on Digital Screen Image

Green-themed digital display shows intertwining themes of inflation data and programming code, evoking high-tech finance. Useful for digital content, financial analysis presentations, business proposals, coding tutorials featuring a fiscal aspect, and articles focusing on economic and technological development.
Powered by 


downloads
Tags:
More
Credit Photo
If you would like to credit the Photo, here are some ways you can do so
Text Link
photo Link
<span class="text-link">
<span>
<a target="_blank" href=https://pikwizard.com/photo/inflation-graph-with-data-code-overlay-on-digital-screen/122261198caa347b2700441546a04d4d/>PikWizard</a>
</span>
</span>
<span class="image-link">
<span
style="margin: 0 0 20px 0; display: inline-block; vertical-align: middle; width: 100%;"
>
<a
target="_blank"
href="https://pikwizard.com/photo/inflation-graph-with-data-code-overlay-on-digital-screen/122261198caa347b2700441546a04d4d/"
style="text-decoration: none; font-size: 10px; margin: 0;"
>
<img src="https://pikwizard.com/pw/medium/122261198caa347b2700441546a04d4d.jpg" style="margin: 0; width: 100%;" alt="" />
<p style="font-size: 12px; margin: 0;">PikWizard</p>
</a>
</span>
</span>
Free (free of charge)
Free for personal and commercial use.
Author: People Creations
Similar Free Stock Images

Premium


Premium

Premium


Premium


Premium
Premium

Premium


Premium


Explore More Free Stock Images