
- Home >
- Stock Photos >
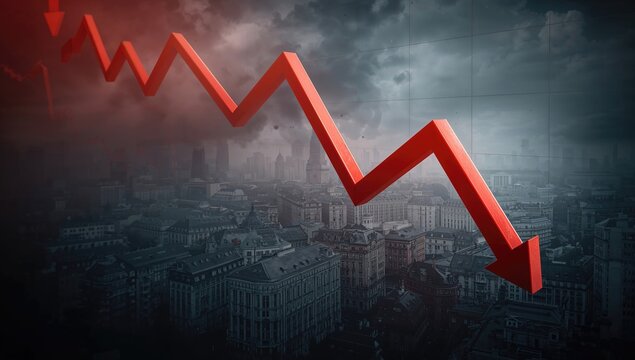
- Inflation Impact with Graphs and Data Overlays in Green
Inflation Impact with Graphs and Data Overlays in Green Image

Energy-packed concept showing 'inflation' text in vibrant green over complex data graphs. Captures economic trends, market analysis, and financial implications of price increases. Ideal for articles on economic analysis, discussion pieces about inflation, and financial planner reports.
Powered by 


downloads
Tags:
More
Credit Photo
If you would like to credit the Photo, here are some ways you can do so
Text Link
photo Link
<span class="text-link">
<span>
<a target="_blank" href=https://pikwizard.com/photo/inflation-impact-with-graphs-and-data-overlays-in-green/5847bcdb54a3dcda497c0d5bad405c81/>PikWizard</a>
</span>
</span>
<span class="image-link">
<span
style="margin: 0 0 20px 0; display: inline-block; vertical-align: middle; width: 100%;"
>
<a
target="_blank"
href="https://pikwizard.com/photo/inflation-impact-with-graphs-and-data-overlays-in-green/5847bcdb54a3dcda497c0d5bad405c81/"
style="text-decoration: none; font-size: 10px; margin: 0;"
>
<img src="https://pikwizard.com/pw/medium/5847bcdb54a3dcda497c0d5bad405c81.jpg" style="margin: 0; width: 100%;" alt="" />
<p style="font-size: 12px; margin: 0;">PikWizard</p>
</a>
</span>
</span>
Free (free of charge)
Free for personal and commercial use.
Author: Creative Art
Similar Free Stock Images

Premium


Premium

Premium

Premium


Premium


Premium


Premium


Premium


Premium


Premium


Premium


Premium


Premium

Premium


Premium

Premium


Premium


Premium


Premium


Premium


Premium


Premium


Premium

Premium
Premium

Explore More Free Stock Images