
- Home >
- Stock Photos >
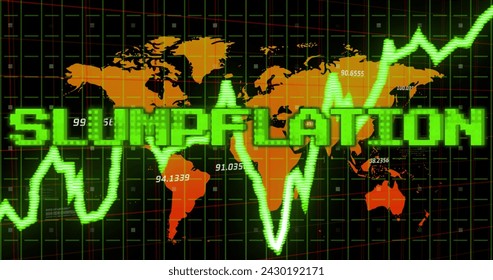
- Inflation Text Over Global Graph and World Map with Data Processing Effect
Inflation Text Over Global Graph and World Map with Data Processing Effect Image

Illustrates concepts of global economic trends and inflation impact. Useful for presentations on market analysis, economic reports, financial debriefing, or educational materials on economics and digital communication strategies.
Powered by  - Get 15% off with code: PIKWIZARD15


Credit Photo
If you would like to credit the Photo, here are some ways you can do so
Text Link
photo Link
<span class="text-link">
<span>
<a target="_blank" href=https://pikwizard.com/photo/inflation-text-over-global-graph-and-world-map-with-data-processing-effect/db5e56a5253985a3481334cbadf80026/>PikWizard</a>
</span>
</span>
<span class="image-link">
<span
style="margin: 0 0 20px 0; display: inline-block; vertical-align: middle; width: 100%;"
>
<a
target="_blank"
href="https://pikwizard.com/photo/inflation-text-over-global-graph-and-world-map-with-data-processing-effect/db5e56a5253985a3481334cbadf80026/"
style="text-decoration: none; font-size: 10px; margin: 0;"
>
<img src="https://pikwizard.com/pw/medium/db5e56a5253985a3481334cbadf80026.jpg" style="margin: 0; width: 100%;" alt="" />
<p style="font-size: 12px; margin: 0;">PikWizard</p>
</a>
</span>
</span>
Free (free of charge)
Free for personal and commercial use.
Author: Awesome Content
Similar Free Stock Images

Premium


Premium

Premium


Premium


Premium


Premium


Premium
Premium


Premium

Premium

Premium


Premium


Premium

Premium

Premium


Premium


Premium

Premium

Premium

Premium

Premium

Premium


Premium


Premium

Premium

Explore More Free Stock Images