- Home >
- Stock Photos >
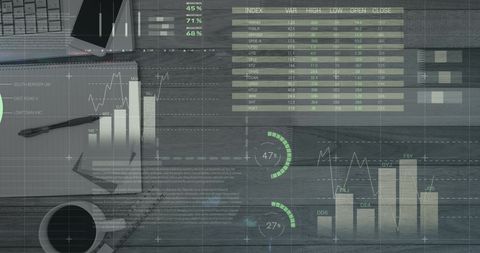
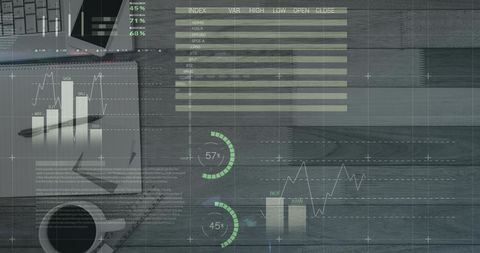
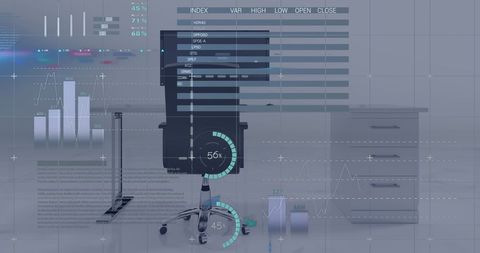
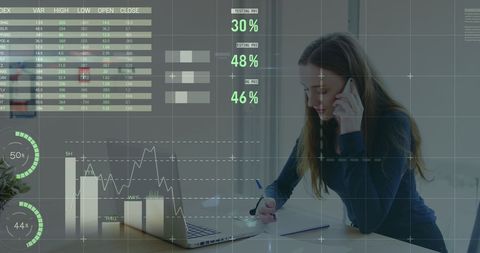
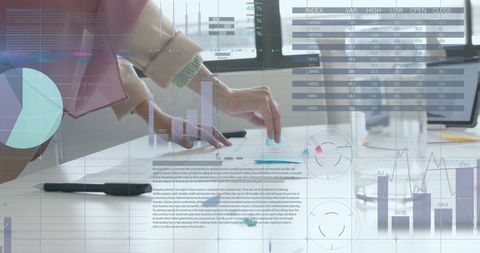
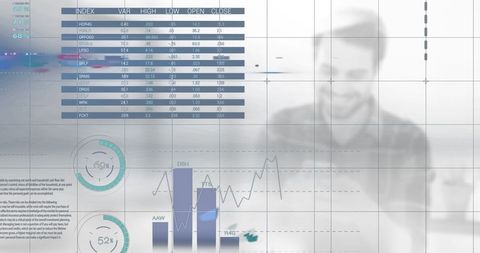
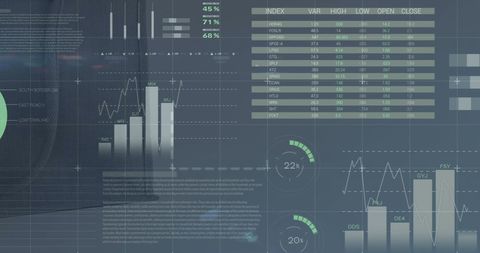
- Infographic Interface and Business Desk Elements Mixed
Infographic Interface and Business Desk Elements Mixed Image

Multiple infographic elements like graphs and data tables overlay elements typically found on a workspace such as a pen, notebook and coffee cup. This depiction suggests concepts of business strategy, progress tracking, working environment and financial analysis. Useful for illustrating themes in business presentations, articles on data-driven decision making, or financial growth.

downloads
Tags:
More
Credit Photo
If you would like to credit the Photo, here are some ways you can do so
Text Link
photo Link
<span class="text-link">
<span>
<a target="_blank" href=https://pikwizard.com/photo/infographic-interface-and-business-desk-elements-mixed/f47c8b841f56b21d83dc1a14869facf7/>PikWizard</a>
</span>
</span>
<span class="image-link">
<span
style="margin: 0 0 20px 0; display: inline-block; vertical-align: middle; width: 100%;"
>
<a
target="_blank"
href="https://pikwizard.com/photo/infographic-interface-and-business-desk-elements-mixed/f47c8b841f56b21d83dc1a14869facf7/"
style="text-decoration: none; font-size: 10px; margin: 0;"
>
<img src="https://pikwizard.com/pw/medium/f47c8b841f56b21d83dc1a14869facf7.jpg" style="margin: 0; width: 100%;" alt="" />
<p style="font-size: 12px; margin: 0;">PikWizard</p>
</a>
</span>
</span>
Free (free of charge)
Free for personal and commercial use.
Author: Awesome Content