1. Home > 
  2. Stock Photos > 
  3. Infographic Interface Overlaid on Notebook with Charts and Doodles

Infographic Interface Overlaid on Notebook with Charts and Doodles Image

Infographic Interface Overlaid on Notebook with Charts and Doodles

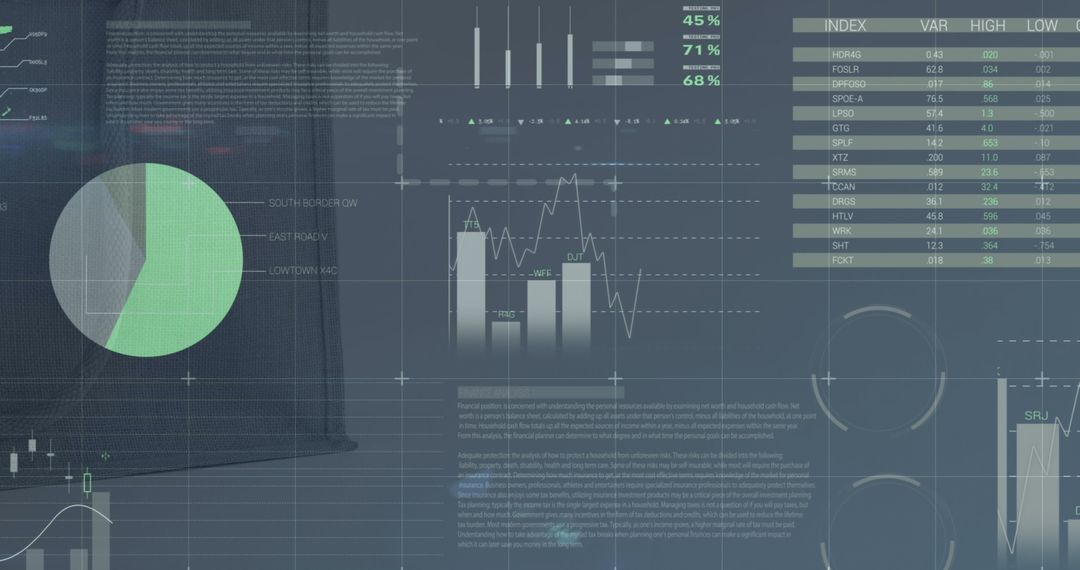
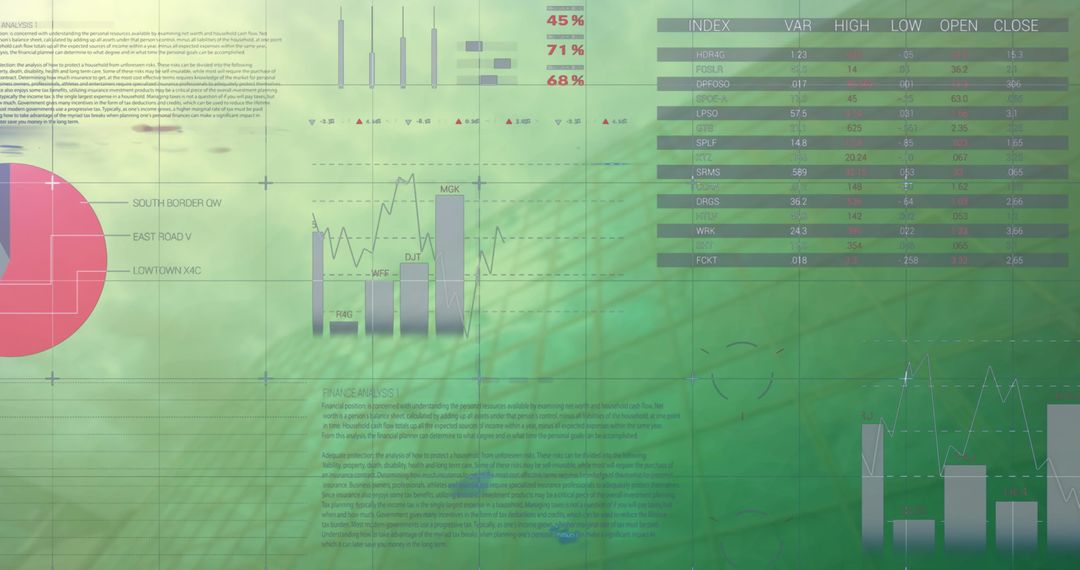
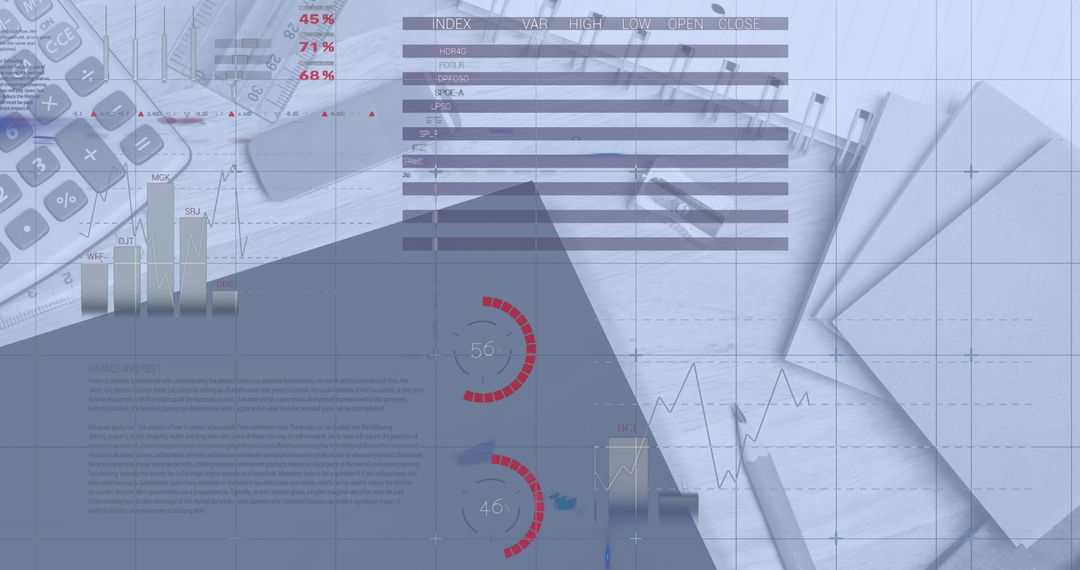
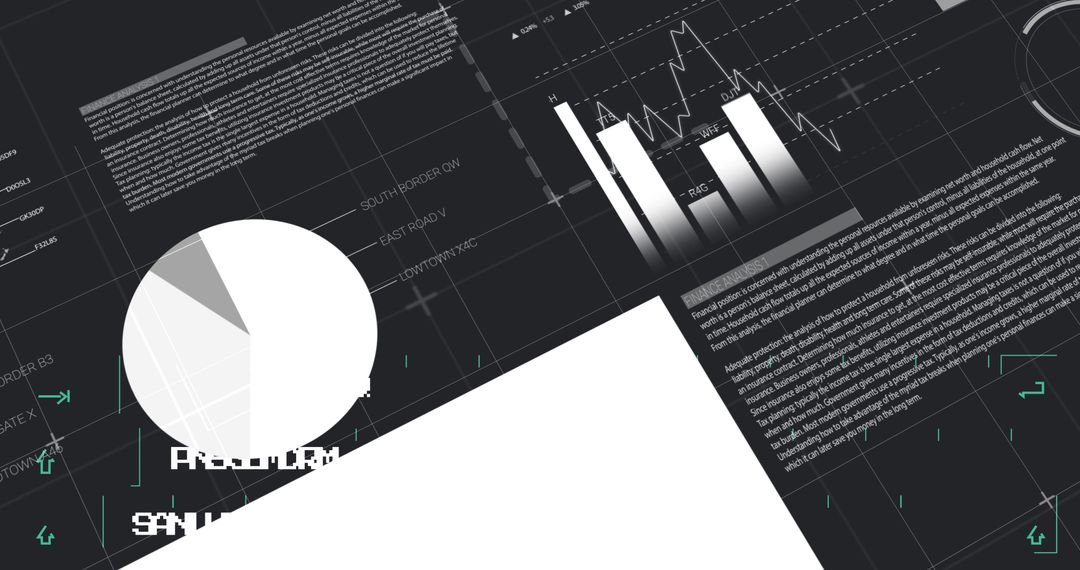
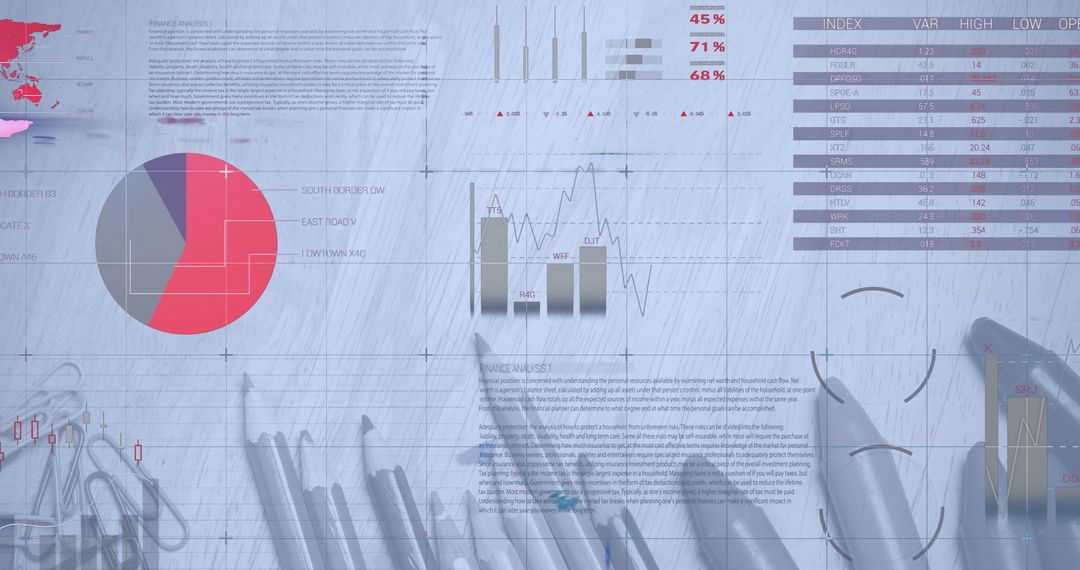
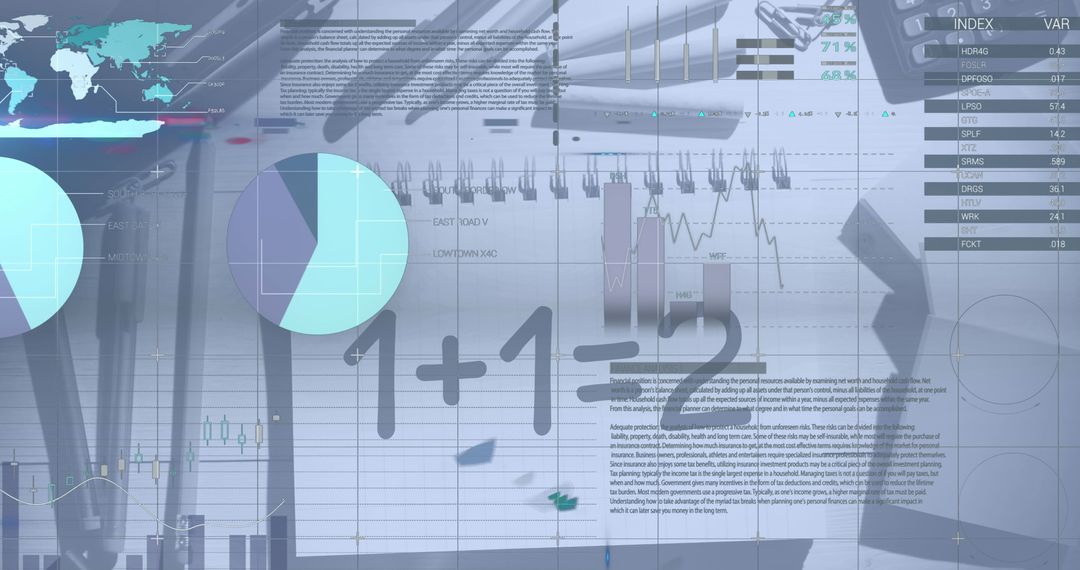
Composite showcasing business analysis and education concepts, blending digital finance graphics with hand-drawn sketches of school items. This image is ideal for articles about business education, creative financial presentations or illustrative blog posts regarding analytics and learning. Visually represents the crossover between traditional and digital learning techniques.

Powered by Shutterstock logo - Get 15% off with code: PIKWIZARD15
Man look at the dashboard with graphs and charts. Concept of data management system, business intelligence, data statistics, marketing analysis, key performance indicators (KPI) and analytics. - Powered by Shutterstock - Get 15% off with code: PIKWIZARD15Woman hold smartphone use pc at workplace. Project stats financial data sales charts on laptop and cellphone screen, close up view over shoulder. Report preparation, synchronization for safety concept - Powered by Shutterstock - Get 15% off with code: PIKWIZARD15Man look at the dashboard with graphs and charts. Concept of data management system, business intelligence, data statistics, marketing analysis, key performance indicators (KPI) and analytics. - Powered by Shutterstock - Get 15% off with code: PIKWIZARD15Female analyst analyzes KPI Business Analytics Data Dashboard Management System on a computer - Powered by Shutterstock - Get 15% off with code: PIKWIZARD15man shows a pointer to search Google holding a book infographics studio background Business Idea - Powered by Shutterstock - Get 15% off with code: PIKWIZARD15

Credit Photo

If you would like to credit the Photo, here are some ways you can do so

Free (free of charge)

Free for personal and commercial use.

Author: People Creations

Similar Free Stock Images

Abstract Finance and Data Analysis with Charts and Graphs
Premium
Displaying data overlay highlighting pie bar line charts and map on wooden desk, with notebook. Analytics, data visualization, dashboard, infographics, business intelligence, corporate, digital
Digital Data Projection and Analysis on Blue Interface
Futuristic Data Analysis Dashboard with Graphs
Global Financial Graphs Over Rotating Digital Globe
Graphical Financial Data Analysis and Market Trends
Premium
Double exposure of creative chemistry concept with man hand writing in notebook on background, research and development concept
Complex Financial Analytics and Data Visualization in Digital Space
Business Strategy Planning with Data Analysis Charts
Futuristic Infographic Analysis with Abstract Pattern Hologram
Digital Education Infographic with Equation Overlay on Tablet
Premium
African american man looking at AR infographics online on laptop, learning safety procedures. Person spending time on internet, using notebook and augmented reality to understand
Abstract Data Visualization with Light Trailing Effects
Environmental Data Visualization with Heavy Machinery Graph
Analyzing Economic Data Finance with Calculator and Documents
Abstract Business Data Analytics and Statistics Visualization
Premium
Creative scientific formula concept and modern desktop with computer on background. Multiexposure
Global Financial Data and Mathematical Integration Concept
Digital Data Processing on Tech Screens with Graphs and Figures
Overlapping Financial Documents with Stationery and Pie Chart
Abstract Financial Data Analytics with Blurred Background
Premium
Blurry male hand using laptop placed on office desk with coffee cup, other items and digital business projection. Blurry woman reading book in the background. Accounting concept. Double exposure
Digital Data Analysis Over Retail Cash Monitor
Futuristic Digital Interface with Data Charts Statistics
Digital Data Processing with Business Interface Elements on White
Global Connectivity Concept with Digital User Profiles
Premium
Concept digital transformation technology strategy, Analyst working with Business, metrics connected to database Corporate.
Digital Infographic Overlay on Tablet with Project Documentation
Abstract Global Technology Background with Mathematical Equations
Futuristic Digital Dashboard with Data Analytics Interface
Futuristic Data Dashboard with Charts and Annotations
Digital Dashboard with Statistical Data Displays Financial Insights
Advanced Digital Interface with Data Analytics Overlaid on Network
Premium
Double exposure of creative scientific formula concept with hand writing in notebook on background with laptop, research and development concept
Digital Display of Bitcoin Overlaid with Data Graphs
Monochromatic Digital Financial Charts 4K Resolution
Abstract Viewed Financial Statistics on Blue Digital Background
Data Analysis with Network of Financial Connections and Graphs
Premium
Infographic of cloudscape reflect to modern multi-cloud technology
Global Economy and Market Dynamics Conceptual Composite
Digital Infographic Interface with Data Visualization Elements
Stock Market Data Overlay Pi Symbol Background
Digital Education Interface with Tablet Screen Displaying ABC
Premium
Creative scientific formula concept with hand writing in notebook on background with laptop. Multiexposure
Digital Data Analysis with Graphs and Charts Interface
Financial Data Processing with Digital Analytics Overlay
Digital Interface Showcasing COVID-19 Statistics and Data Visualization
Futuristic Digital Dashboard with Financial Data Analysis
Premium
Female hand touching screen modern tablet with business icons and symbols.
Digital Financial Data Analysis with Charts and Calculations
Digital Financial Data Processing with Charts and Graphs
Abstract Data Analytics and Technology Concept on Workplace
Motivational Message on Calendar with COVID-19 Imagery
Premium
New media technologies for business . Mixed media
Business Strategy Meeting with Architect Plans and Data Analytics Overlay
Abstract Digital Data Analysis on Futuristic Interface
Education Trends in Digital Era: Back to School and Data Analysis Concept
Business Infographic and Tablet with Financial Chart Overlays
Premium
New media technologies for business . Mixed media
Data Analysis with Futuristic AI Dashboard Interface
Futuristic Holographic Analytics Dashboard Display
Digital Analytics Dashboard with Bar Charts and Metrics
Global Business Analytics and Financial Market Data Visualization
Futuristic Technology Display with Mathematical Solutions Overlay
Futuristic Blue Data Analytics Interface with Graphs and Statistics
Premium
Digital transformation technology strategy, digitization and digitalization of business processes and data, optimize and automate operations, customer service management, internet and cloud computing
Futuristic Digital Interface with Data and Connections
Abstract Data and Statistics on Transparent Business Screen
Digital Analytics Spreadsheet with Pi Vorlage and Graph Elements
Digital Finance Overlay on US Dollars and Notebook
Premium
New media technologies for business . Mixed media
Digital Interface with Financial Analytics and Data Processing
Digital Infographics and Counselling Concept Overlaid on Notepad
Digital Clock Graphic Overlay with Stationery and Infographic Elements
Futuristic Data Processing with Graphs and Charts Overlay
Premium
Portrait of a Smart Focused Young Man Wearing Glasses Holds Laptop. In the Background Technical Department Office with Specialists Working and Functional Data Server Racks
Abstract Data Interface in Urban Context Representing Business Trends
Composite of Statistical Data and Office Tools on Desk
Financial Data and Analytics Visualization in Digital Interface
Abstract Representation of Financial Analysis and Data Processing
Premium
Close up of male hand using laptop keyboard with glowing digital business interface with charts on blurry office background. Infographic and big data concept. Double exposure
Digital Data Analytics with Interactive Charts and Global Visualization
Data Analysis Concept with Pie Charts on Office Desk
Global Healthcare Technology and Economic Data Integration
Social Media Like Icons and Statistics Interface
Premium
Creative scientific formula concept on modern laptop background. Multiexposure
Futuristic Data Analytics Interface with Glowing Graphs and Charts
Abstract Financial Analysis with Pie Charts and Graphs
Interactive Infographic and Abc on Digital Tablet with Stationery
Global Business Network and Collaboration Conceptual Design
Premium
Focused woman working on laptop and writing in notebook, speaking on phone with digital hexagons and binary code overlay, concept of data analysis
Analyst Examines Holographic Data and Maps in High-Tech Control Room
Futuristic Data Visualization Dashboard with Bar Charts and Gauges
Technology Concept with Seamless Integration of Digital Graphs and Transmission Towers
Visualizing Corporate Data with Environmental Context
Digital Data Interface with Charts and Text Analysis
Economic Turmoil Amid Ukraine Crisis Illustrated by Graphs and Flag
Premium
Side view of laptop with e-mail interface on blurry background. Email network concept
Abstract Financial Data with Network and Equation Elements
Financial Data and Network Technology Overlay
Abstract Digital Graphs and Financial Data Visualization Interface
Invigorated Analyst Evaluating Complex Financial Data Visualizations
Premium
Happy asian young businesswoman using laptop with business finance chart dashboard on virtual screen and standing in office  working space, Business finance data analytics and market concept.
Digital Infographic and Alarm Concept with Office Stationery
Futuristic Interface with Statistical Data and Graphs
Abstract Grey Charts on White Business Background
Financial Data Processing on Blue Background
Premium
Concept digital transformation technology strategy, Analyst working with Business, metrics connected to database Corporate.
Digital Data Analysis and Business Technology Interface
Digital Interface with Financial and Statistical Data Visualizations
Financial Analysis with Mathematical Formulas and Calculations
Digital Financial Data Analysis on Workspace with Stationery
Premium
Image of caucasian teacher teaching multiracial students using laptop over infographic interface. Digital composite, multiple exposure, education, data, reports, childhood, e-learning, technology.
Cloud-Based Financial Data Processing with Global Analytics
Globe of Digital Icons on Microprocessor Connections
Digital Data Processing Interface with Dynamic Graphs and Statistics
Digital Financial Data Visualizations with Thumbs Up Icons
Premium
Creative chemistry concept with hand writing in notebook on background with laptop. Multiexposure
Infographic Interface with Financial Data and Mathematical Notation
Infographic Interface on Tablet with Stationery for Digital Analysis
Dynamic Infographic and Stationery Over Mixed Digital Overlay
Abstract Network Visualization of Geometric Shapes and Nodes
Premium
Person using laptop with AI interface and data analytics charts
Digital Financial Dashboard with Data Visualization and Charts