- Home >
- Stock Photos >
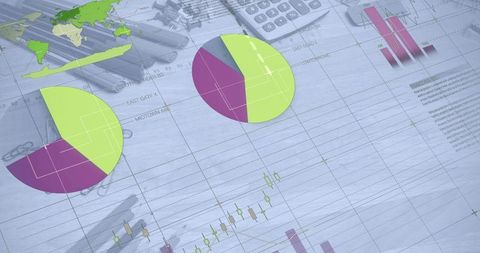
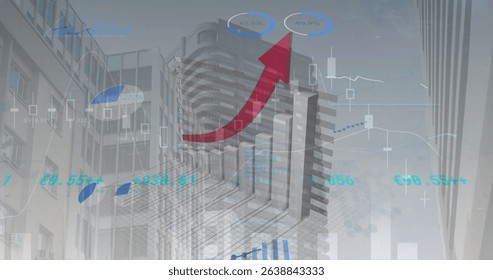
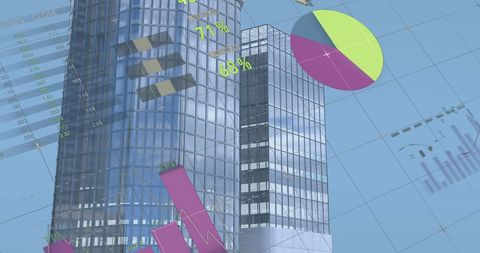
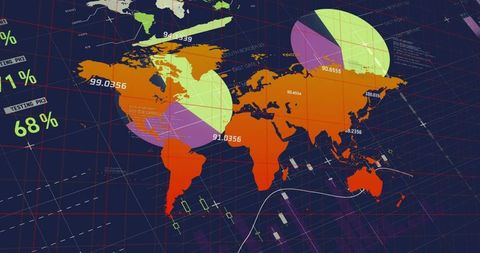
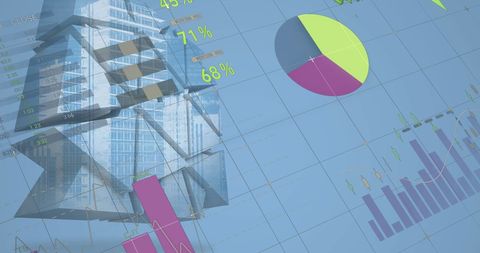
- Infographic of Global Business Statistics Over Modern Building
Infographic of Global Business Statistics Over Modern Building Image
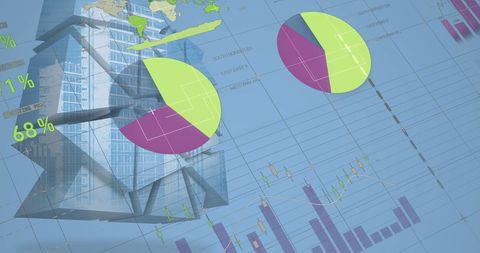
Visualizing data processing and business statistics overlaid on modern skyscrapers, this depiction sets a futuristic tone ideal for use in financial presentations, articles on global economy trends, and technology blogs. It is effectively used for showcasing urban growth and advancements in data analytics in urban backdrops.
Powered by  - Get 15% off with code: PIKWIZARD15


2
downloads
downloads
Tags:
More
Credit Photo
If you would like to credit the Photo, here are some ways you can do so
Text Link
photo Link
<span class="text-link">
<span>
<a target="_blank" href=https://pikwizard.com/photo/infographic-of-global-business-statistics-over-modern-building/b7a0618fa94f9ab697cca6fa7ecb8294/>PikWizard</a>
</span>
</span>
<span class="image-link">
<span
style="margin: 0 0 20px 0; display: inline-block; vertical-align: middle; width: 100%;"
>
<a
target="_blank"
href="https://pikwizard.com/photo/infographic-of-global-business-statistics-over-modern-building/b7a0618fa94f9ab697cca6fa7ecb8294/"
style="text-decoration: none; font-size: 10px; margin: 0;"
>
<img src="https://pikwizard.com/pw/medium/b7a0618fa94f9ab697cca6fa7ecb8294.jpg" style="margin: 0; width: 100%;" alt="" />
<p style="font-size: 12px; margin: 0;">PikWizard</p>
</a>
</span>
</span>
Free (free of charge)
Free for personal and commercial use.
Author: People Creations
Similar Free Stock Images
Loading...

Premium


Premium

Premium


Premium


Premium


Premium


Premium


Premium

Premium

Premium

Premium


Premium


Premium


Premium


Premium


Premium


Premium


Premium


Premium


Premium


Premium

Premium


Premium


Premium


Premium