- Home >
- Stock Photos >
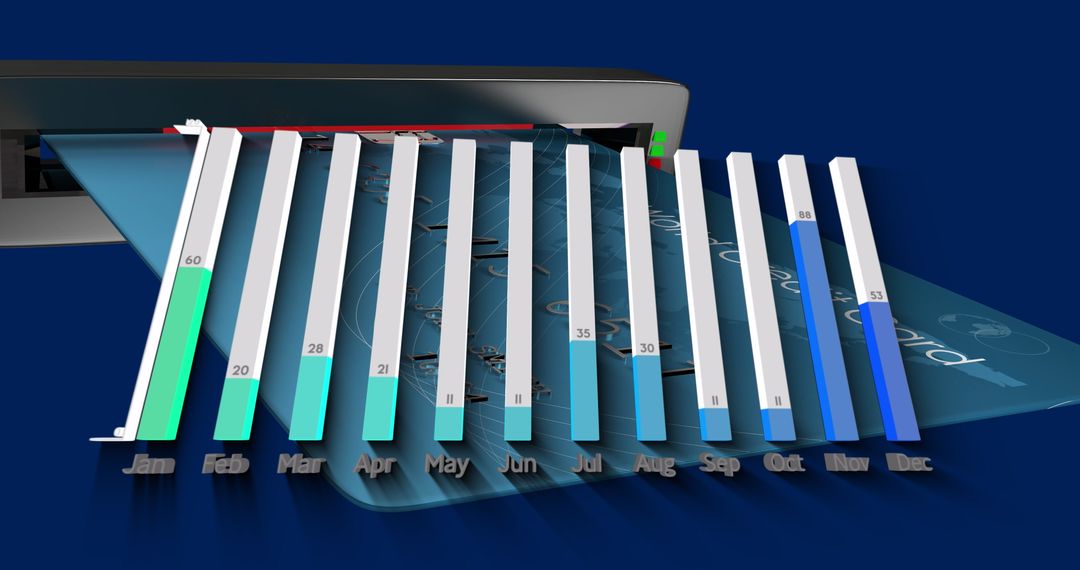
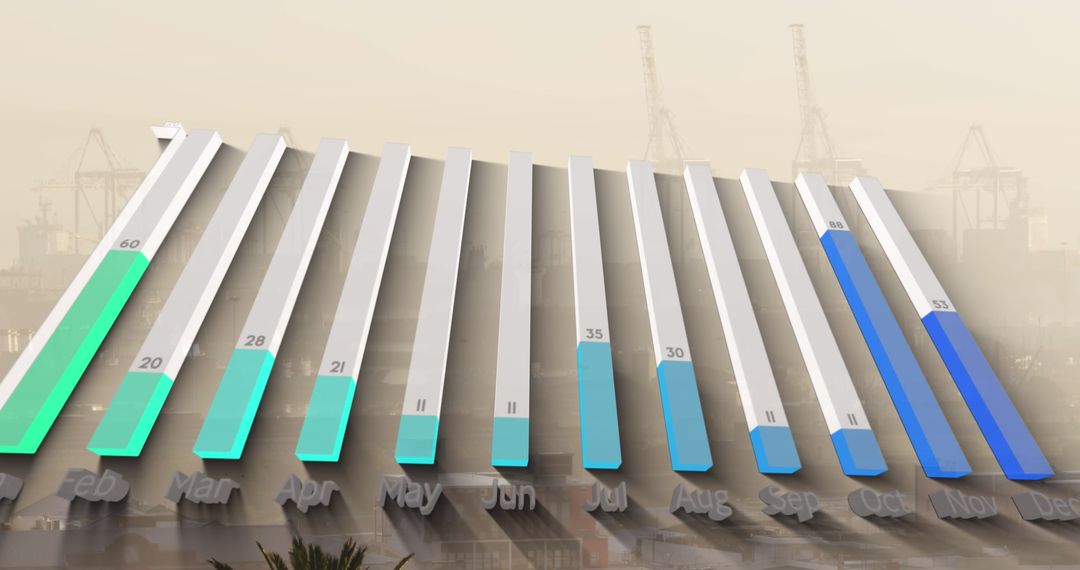
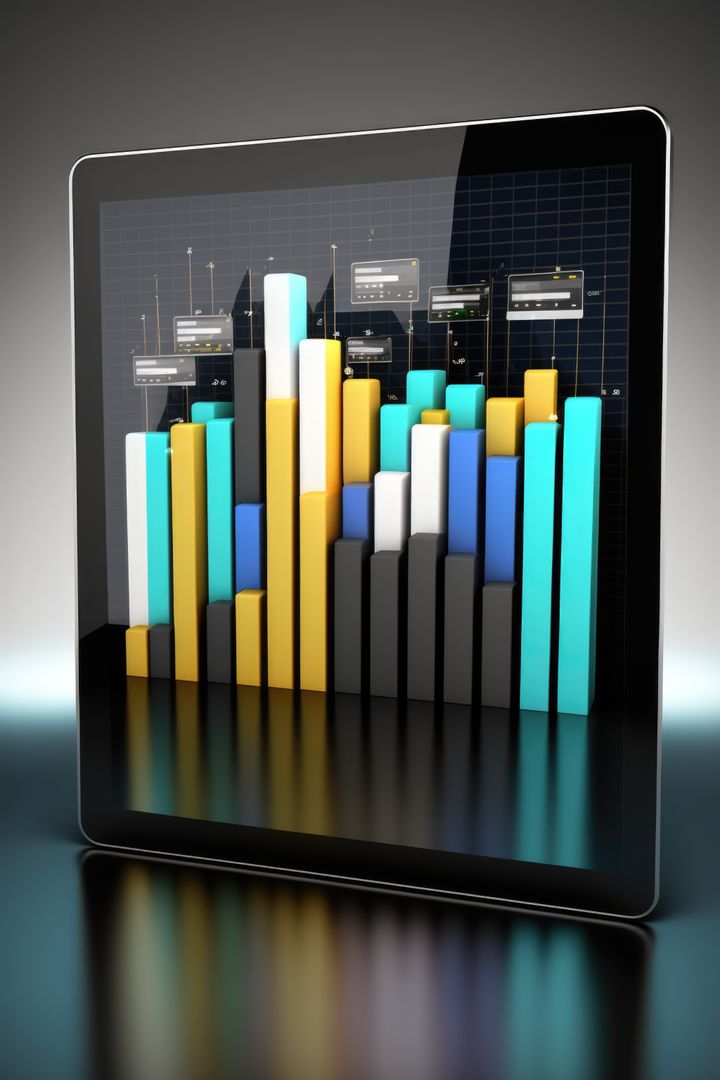
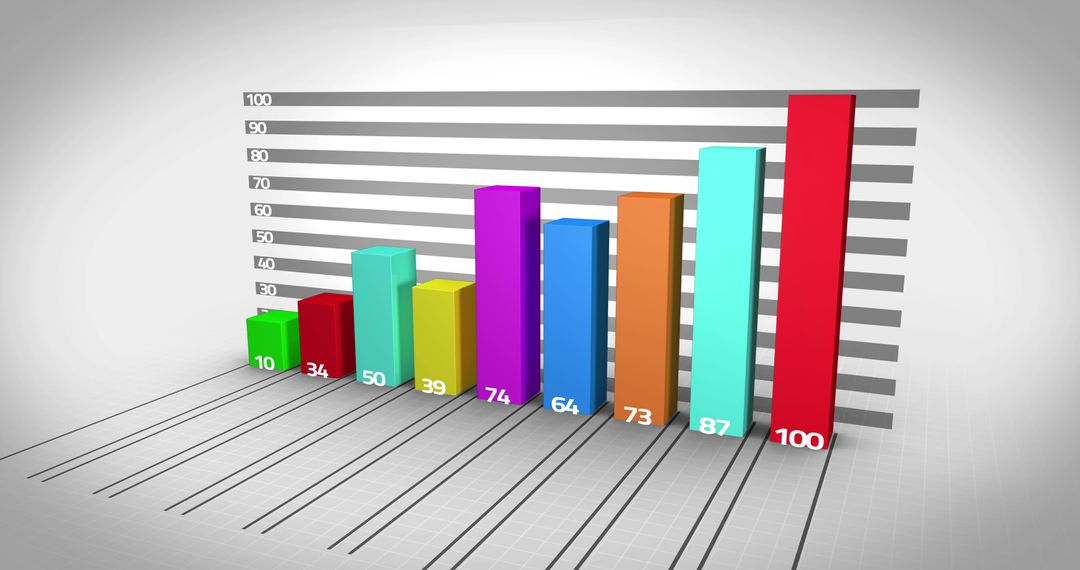
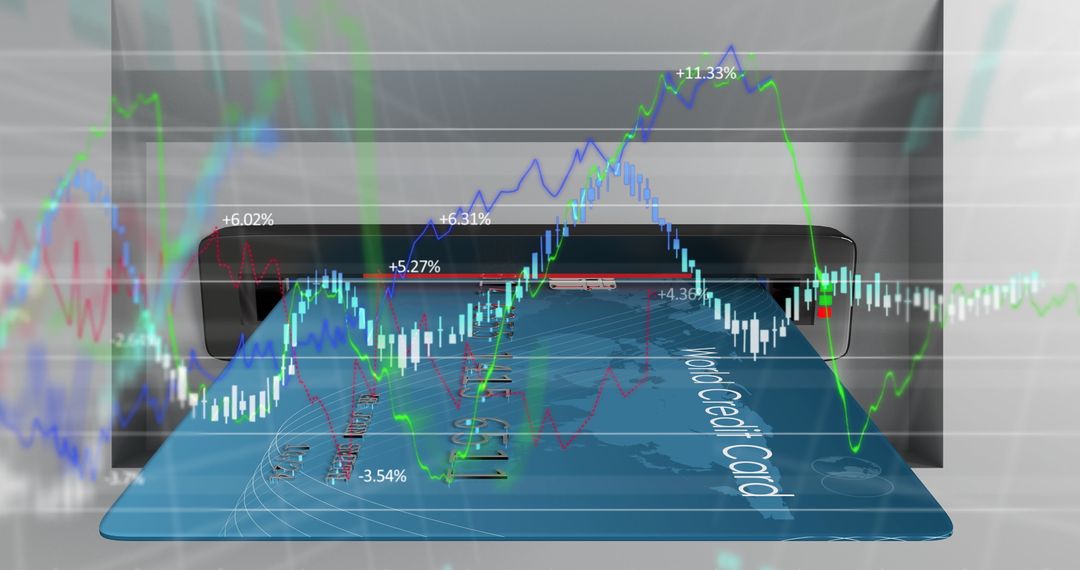
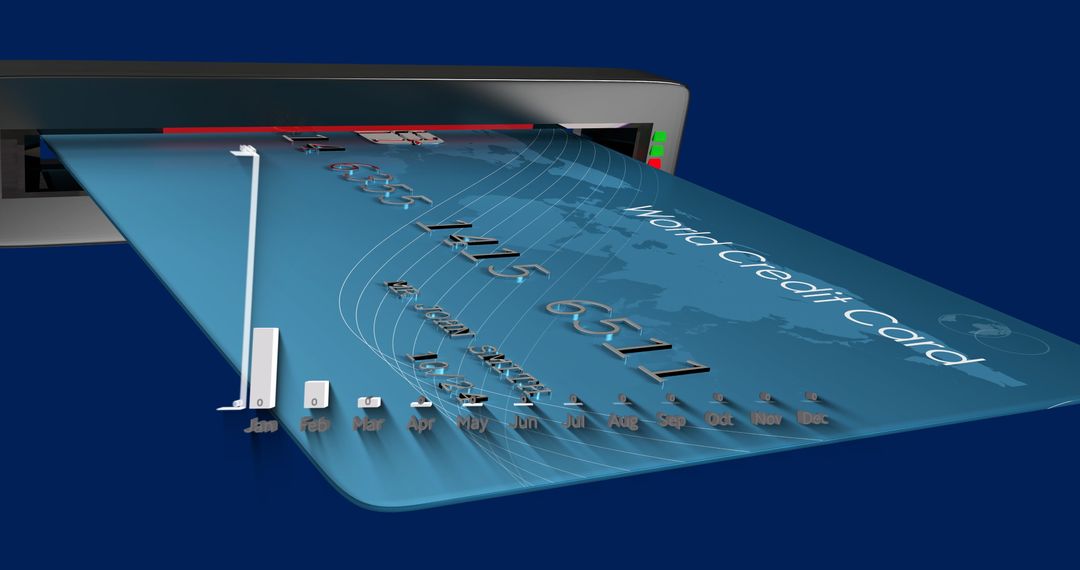
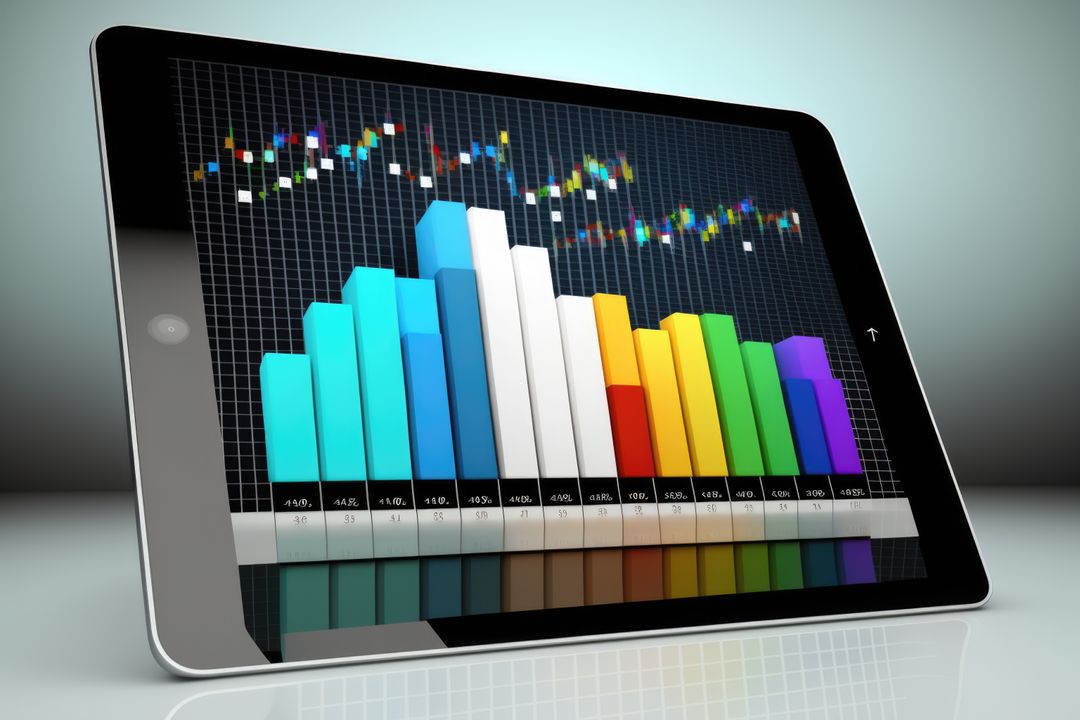
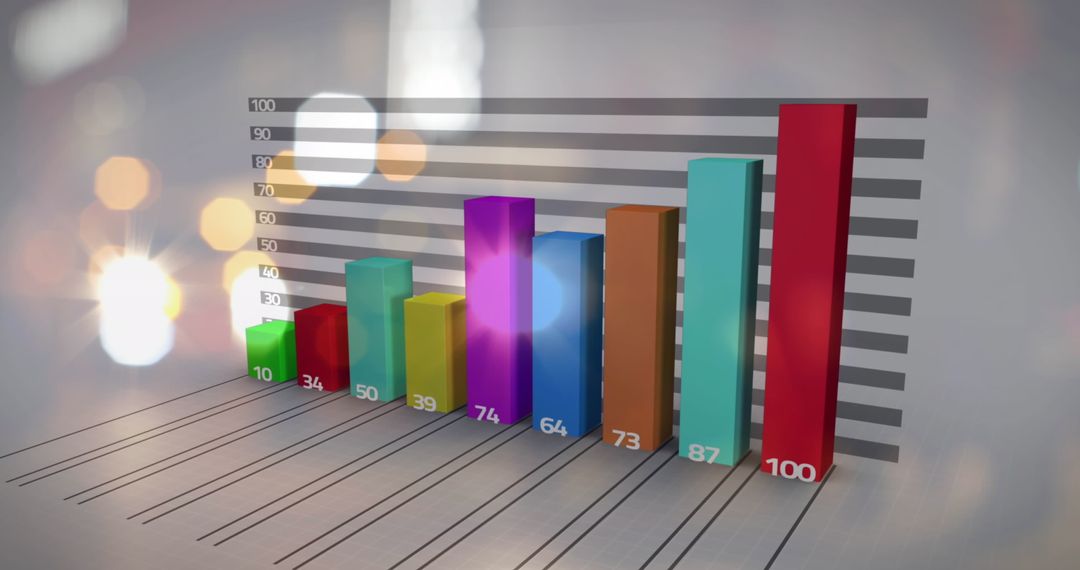
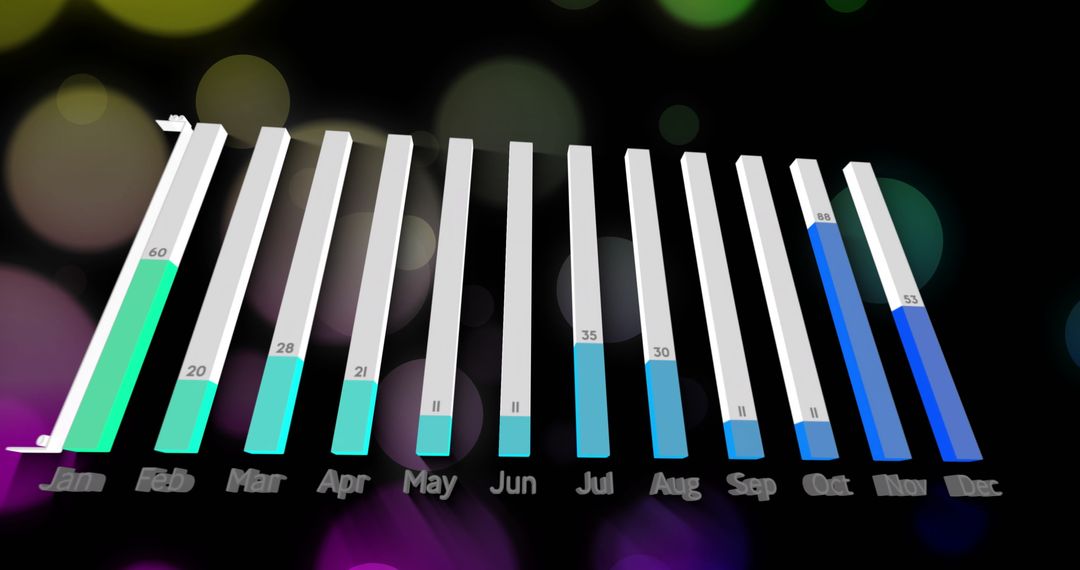
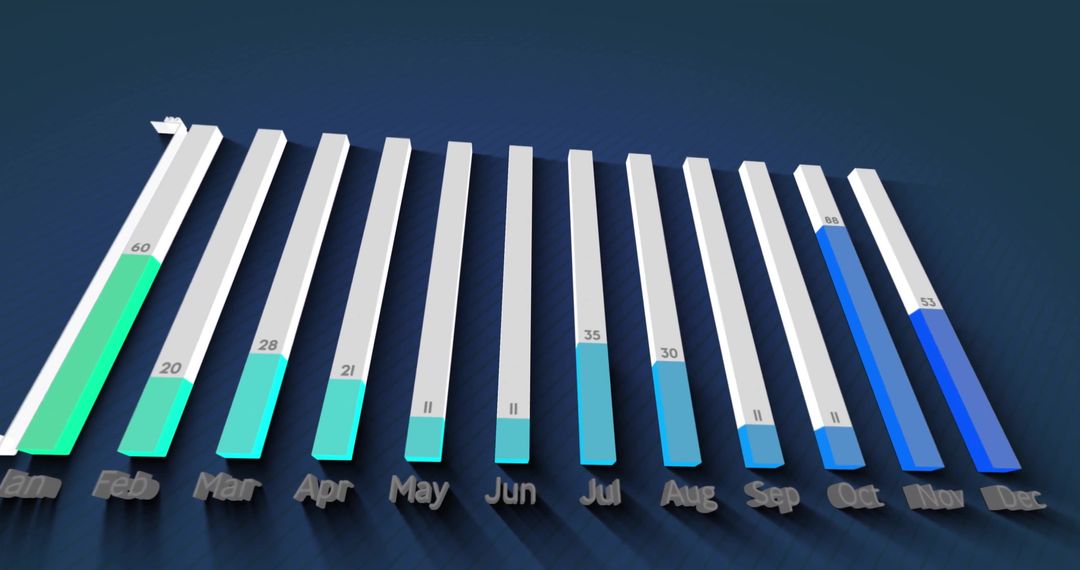
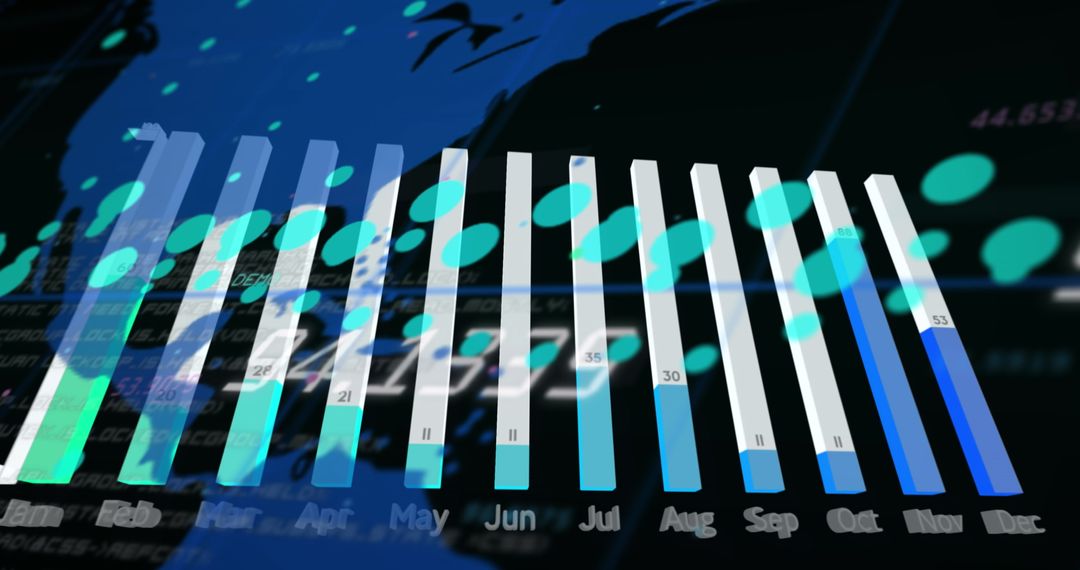
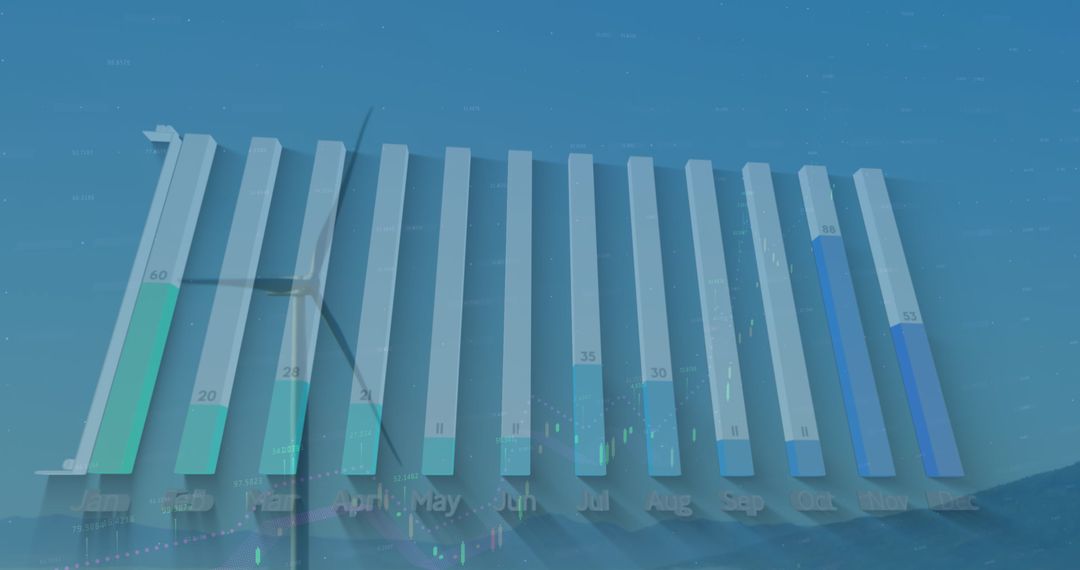
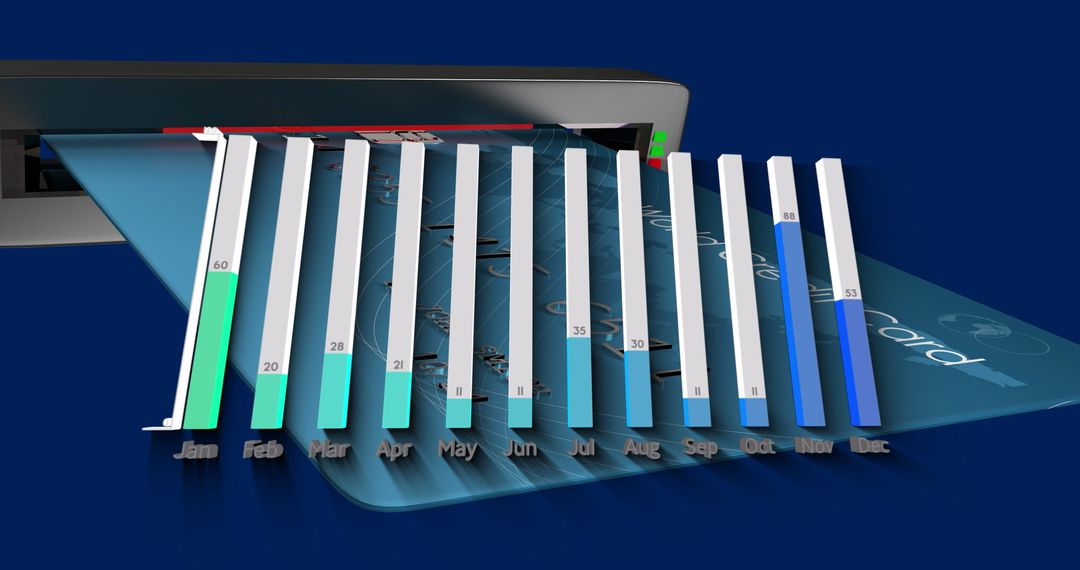
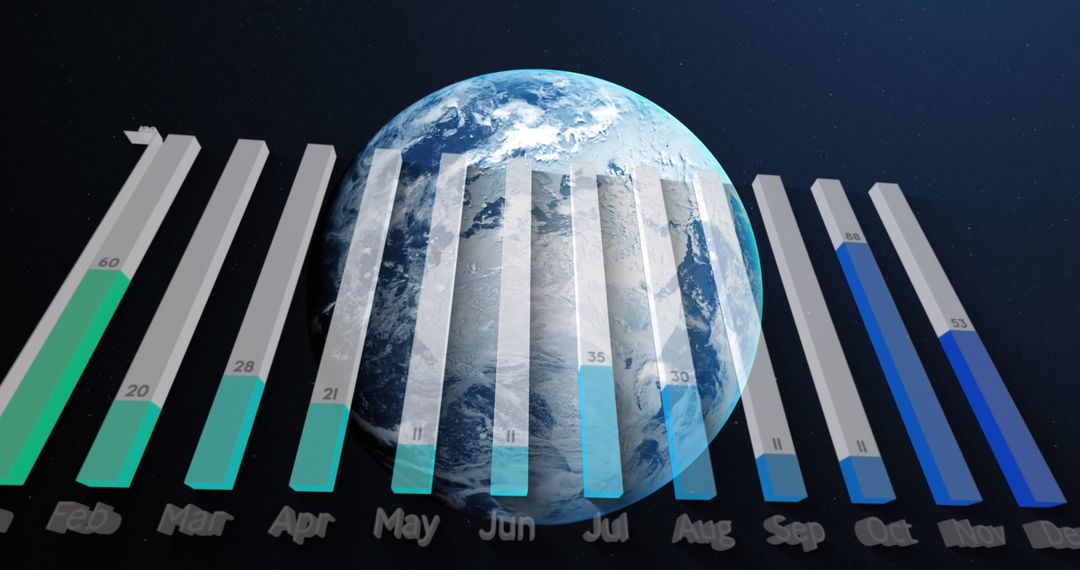
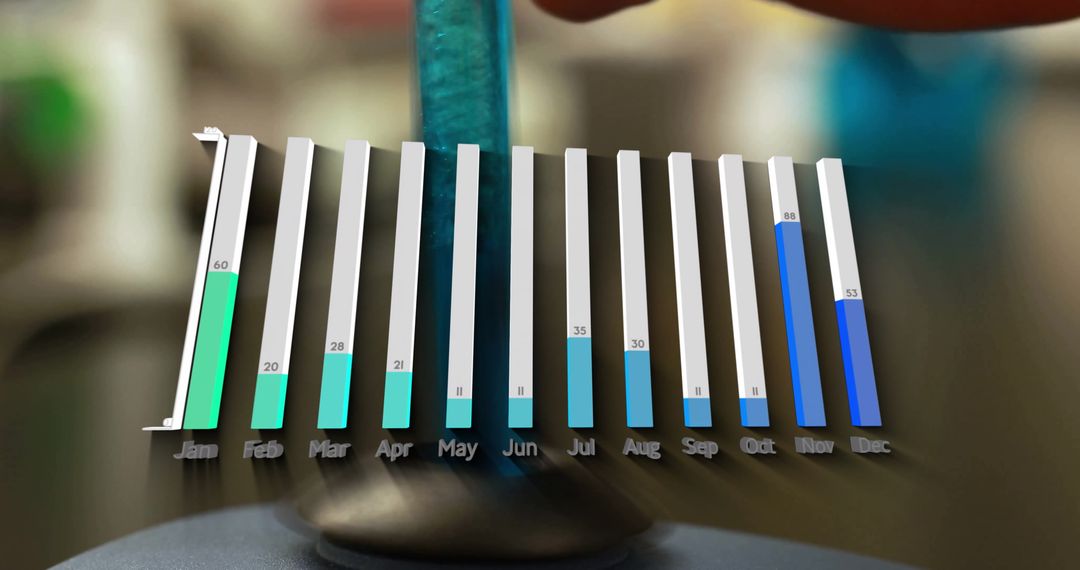
- Innovative 3D Graph Display for Business Analytics
Innovative 3D Graph Display for Business Analytics Image
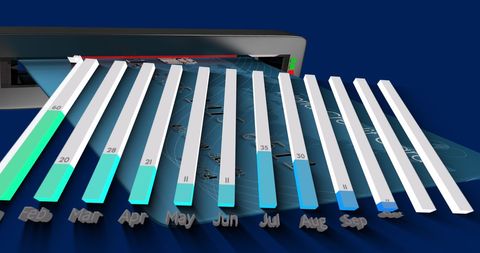
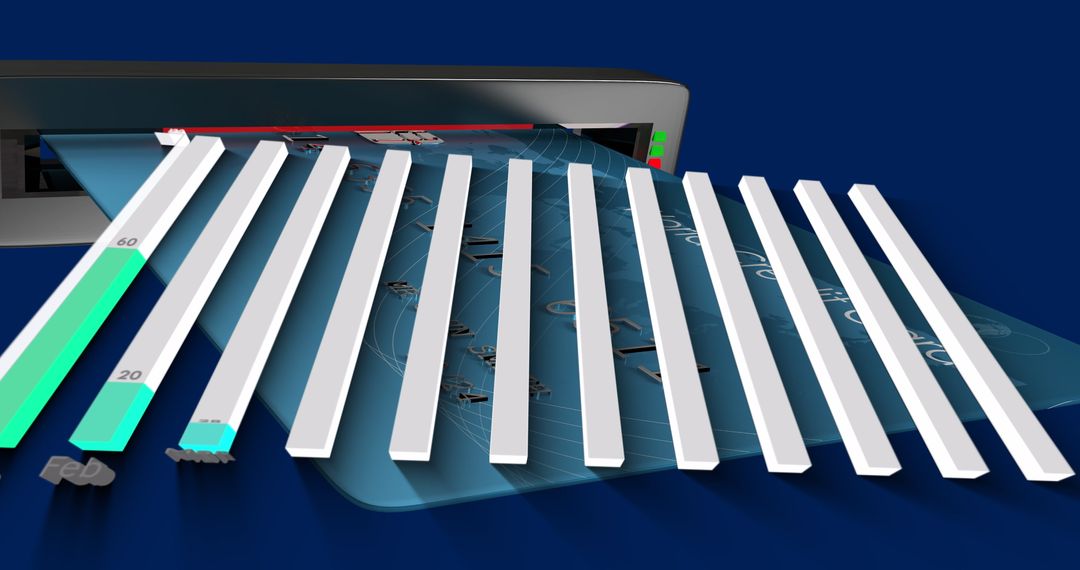
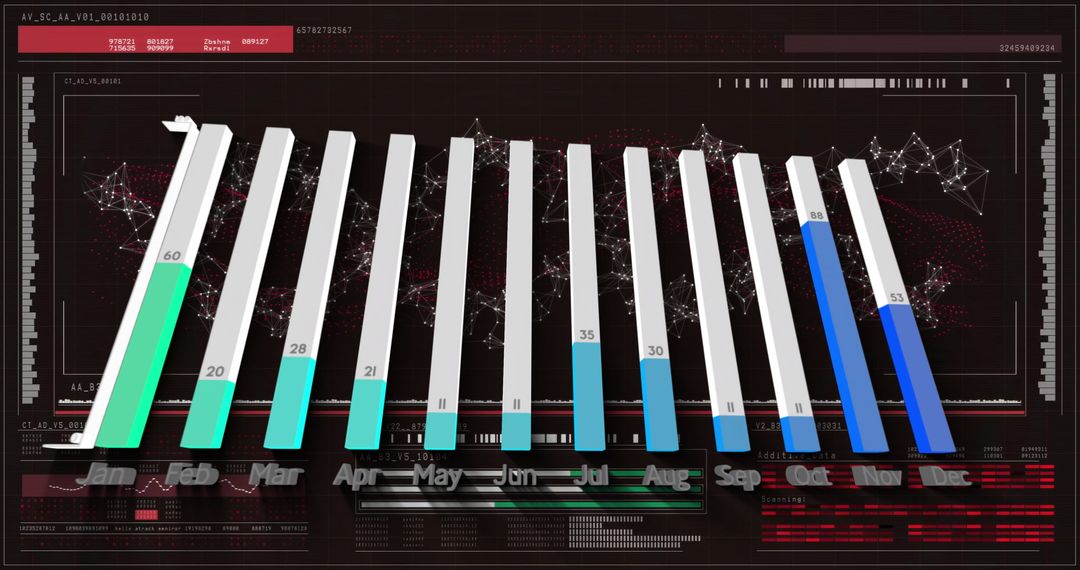
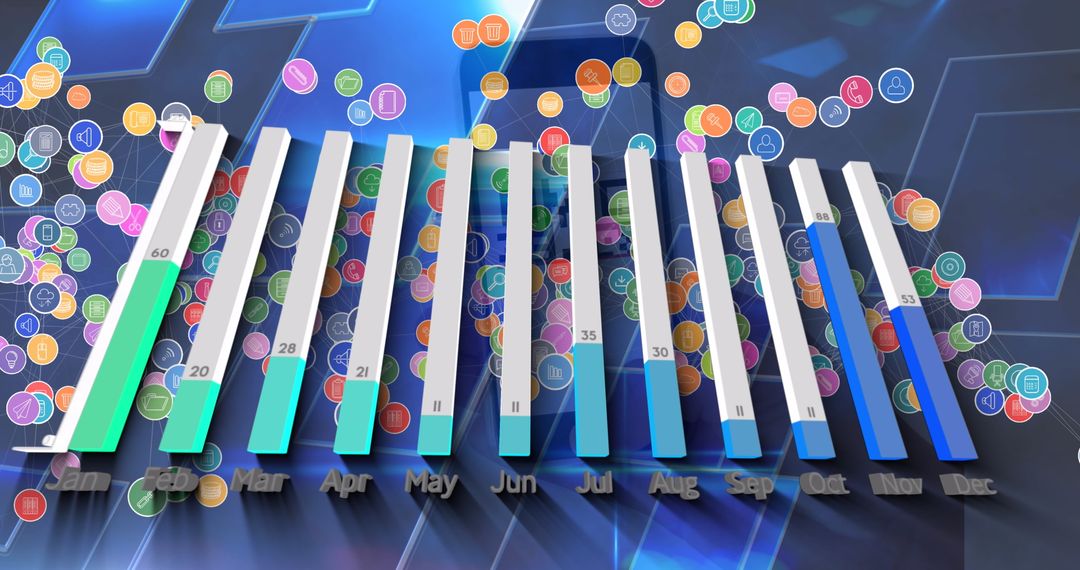
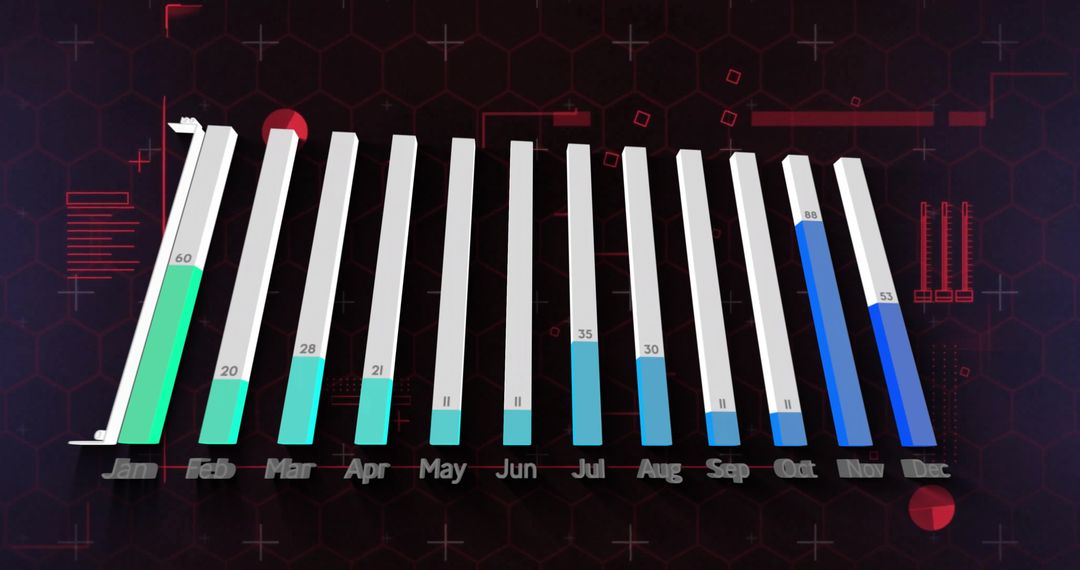
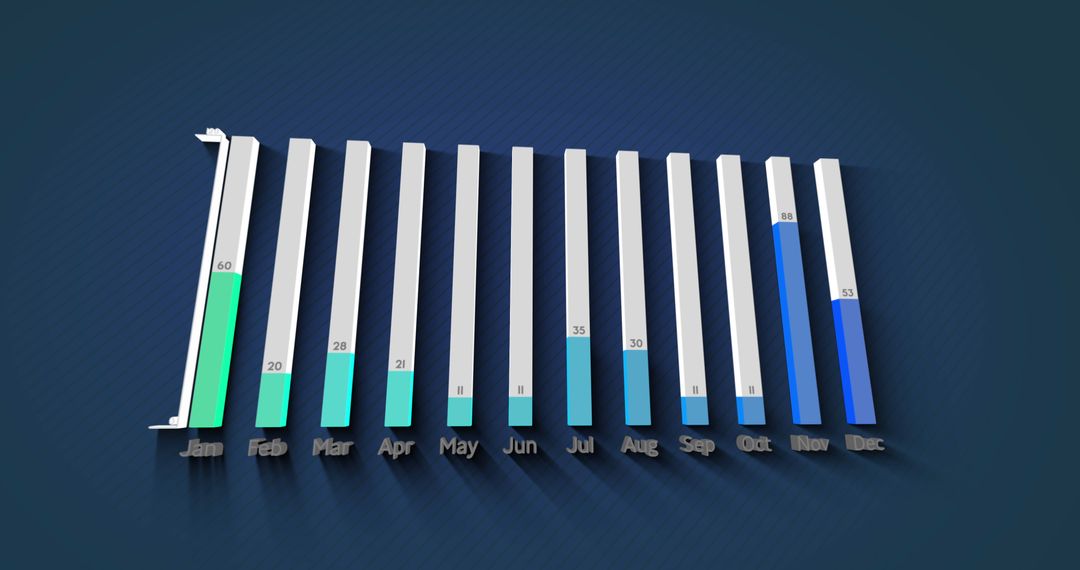
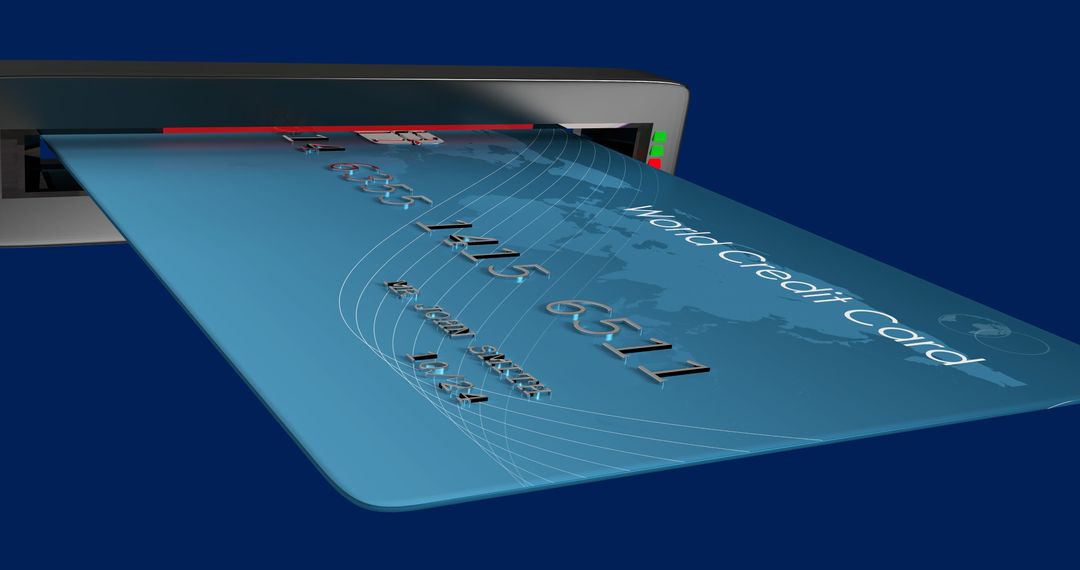
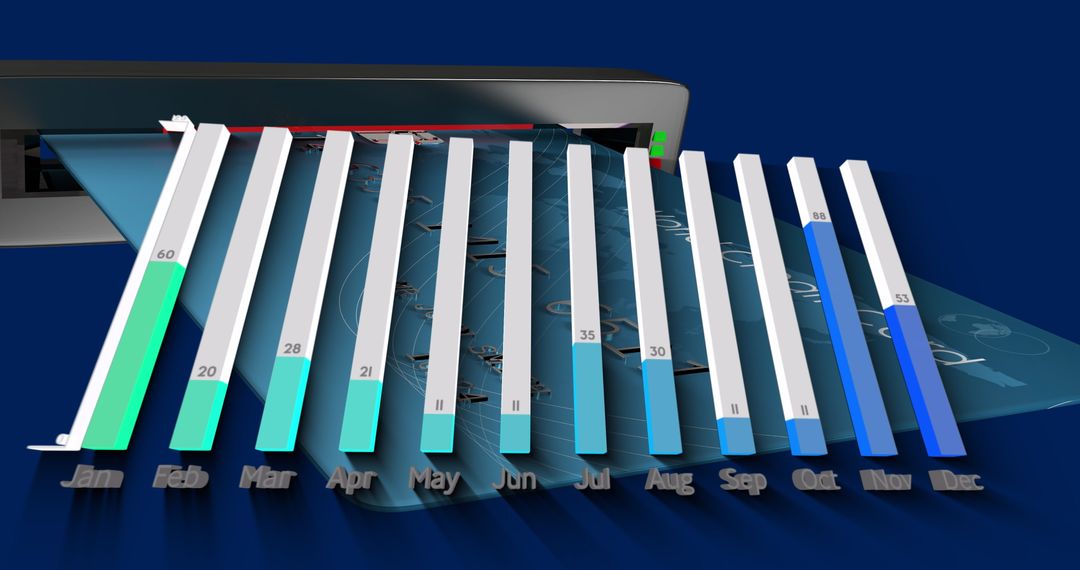
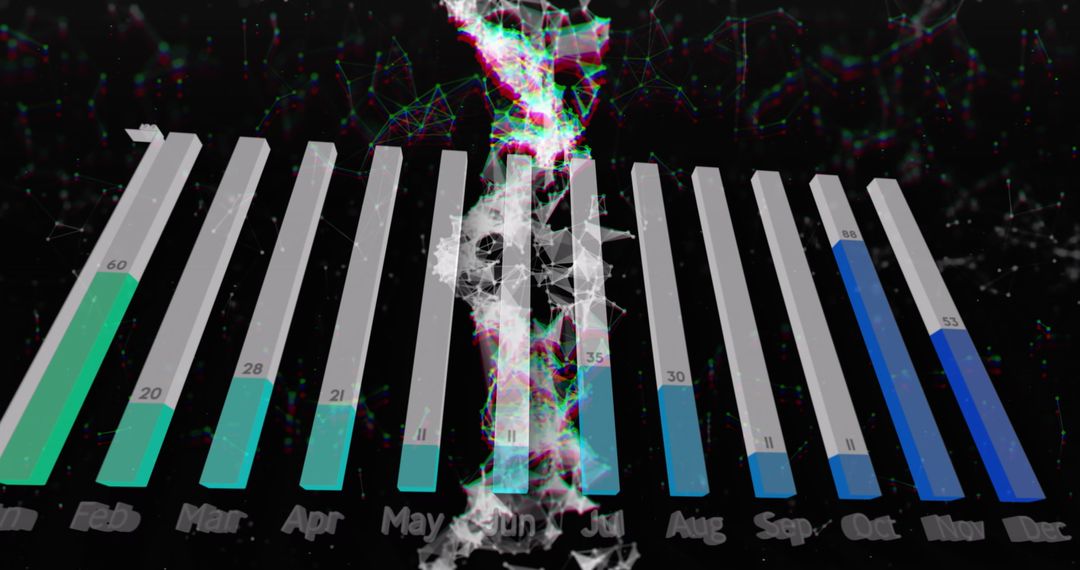
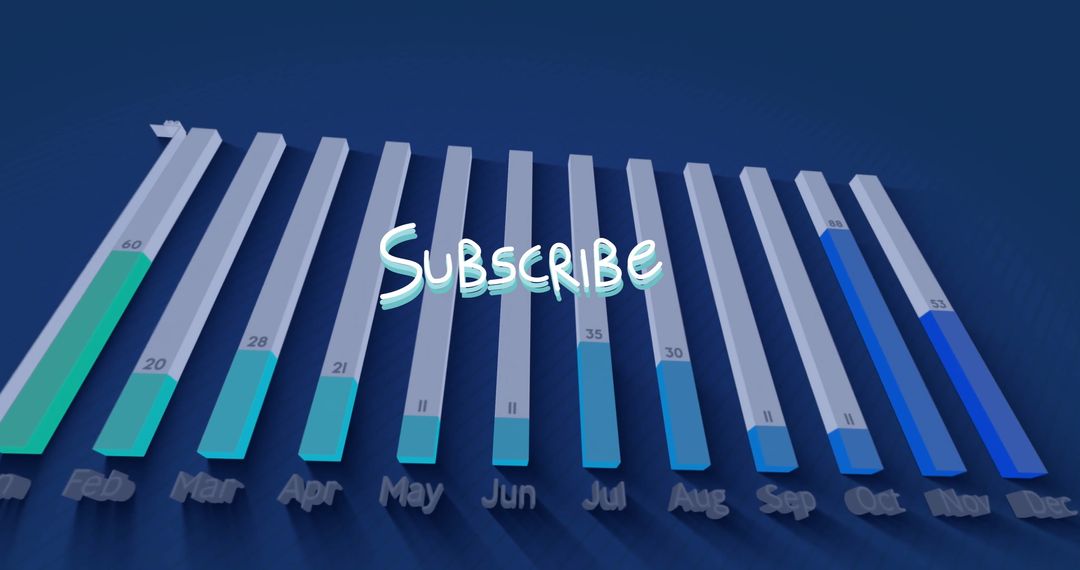
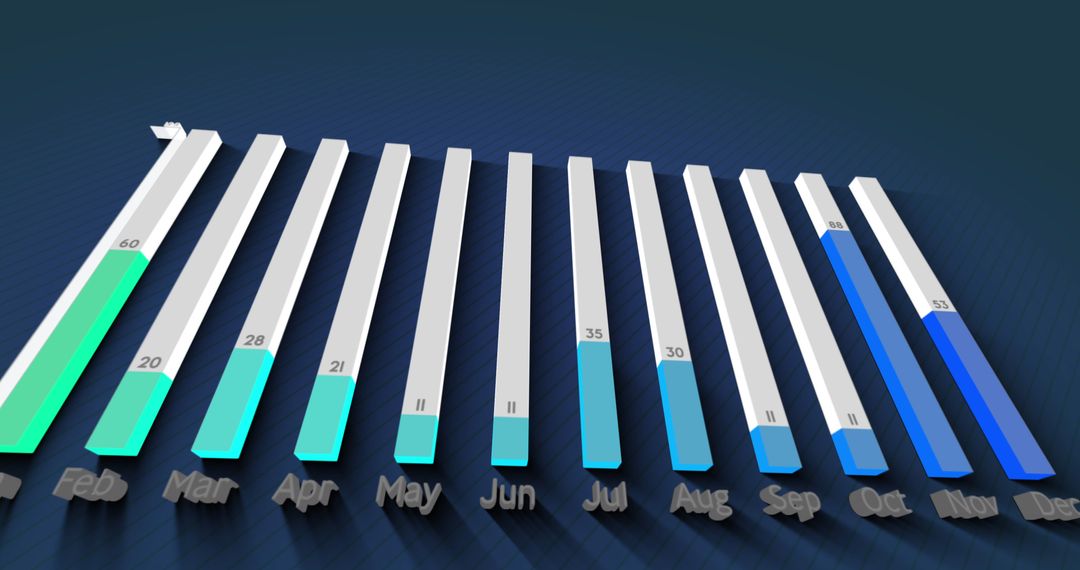
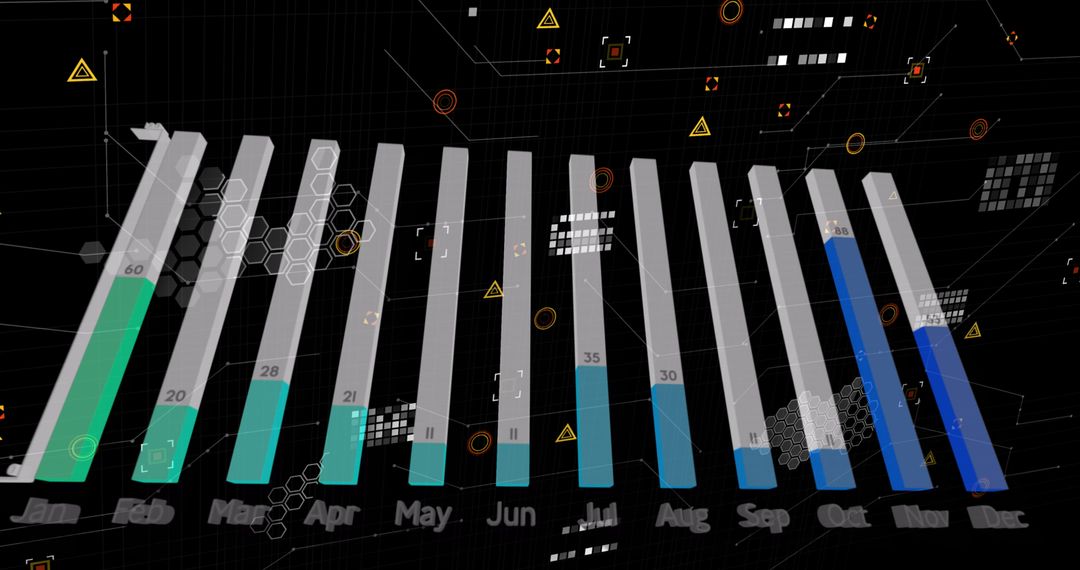
This 3D visualization portrays dynamic growth trends in a business setting using bar graphs extending from a digital screen. Ideal for presentations on market analysis, data visualization techniques, or technology-driven business strategies, it emphasizes the impact of innovative tools in analyzing and presenting complex data effectively.
Powered by 


Credit Photo
If you would like to credit the Photo, here are some ways you can do so
Text Link
photo Link
<span class="text-link">
<span>
<a target="_blank" href=https://pikwizard.com/photo/innovative-3d-graph-display-for-business-analytics/c9a83382c01d2816cc829032c0734ea1/>PikWizard</a>
</span>
</span>
<span class="image-link">
<span
style="margin: 0 0 20px 0; display: inline-block; vertical-align: middle; width: 100%;"
>
<a
target="_blank"
href="https://pikwizard.com/photo/innovative-3d-graph-display-for-business-analytics/c9a83382c01d2816cc829032c0734ea1/"
style="text-decoration: none; font-size: 10px; margin: 0;"
>
<img src="https://pikwizard.com/pw/medium/c9a83382c01d2816cc829032c0734ea1.jpg" style="margin: 0; width: 100%;" alt="" />
<p style="font-size: 12px; margin: 0;">PikWizard</p>
</a>
</span>
</span>
Free (free of charge)
Free for personal and commercial use.
Author: People Creations
Similar Free Stock Images
Premium


Premium


Premium


Premium


Premium


Premium


Premium


Premium


Premium


Premium


Premium


Premium


Premium


Premium

Premium


Premium


Premium


Premium


Premium


Premium


Premium


Premium


Premium

Premium