
- Home >
- Stock Photos >
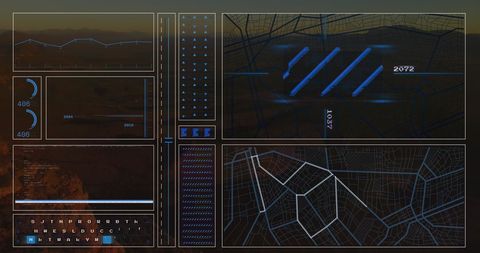
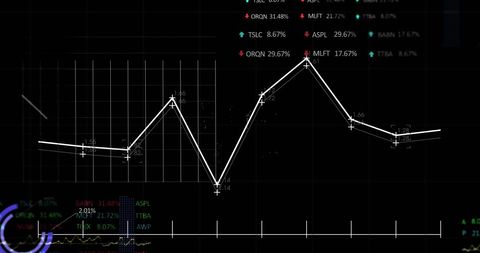
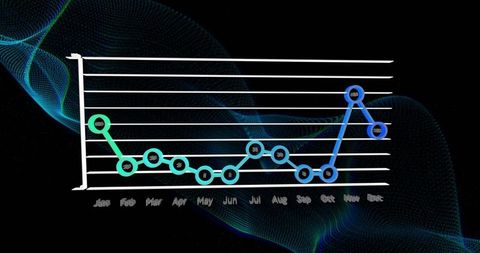
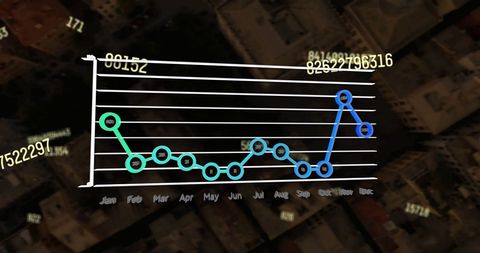
- Innovative Data Dashboard with Monthly Analytics Visualization
Innovative Data Dashboard with Monthly Analytics Visualization Image

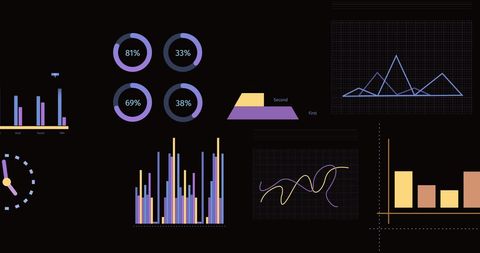
This image depicts a futuristic digital dashboard featuring a teal and blue line chart that showcases monthly analytics data, embedded with gauge indicators and bar charts. Ideal for use in presentations, reports, or publications focusing on finance, business intelligence, or technology sectors. Highlights the sophistication and functionality of modern digital interfaces in scenario of real-time data analysis.
Powered by 


downloads
Tags:
More
Credit Photo
If you would like to credit the Photo, here are some ways you can do so
Text Link
photo Link
<span class="text-link">
<span>
<a target="_blank" href=https://pikwizard.com/photo/innovative-data-dashboard-with-monthly-analytics-visualization/9c78721f070defd55465c4e68b94256b/>PikWizard</a>
</span>
</span>
<span class="image-link">
<span
style="margin: 0 0 20px 0; display: inline-block; vertical-align: middle; width: 100%;"
>
<a
target="_blank"
href="https://pikwizard.com/photo/innovative-data-dashboard-with-monthly-analytics-visualization/9c78721f070defd55465c4e68b94256b/"
style="text-decoration: none; font-size: 10px; margin: 0;"
>
<img src="https://pikwizard.com/pw/medium/9c78721f070defd55465c4e68b94256b.jpg" style="margin: 0; width: 100%;" alt="" />
<p style="font-size: 12px; margin: 0;">PikWizard</p>
</a>
</span>
</span>
Free (free of charge)
Free for personal and commercial use.
Author: Awesome Content
Similar Free Stock Images

Premium


Premium


Premium


Premium


Premium


Premium


Premium


Premium


Premium


Premium


Premium


Premium


Premium


Premium


Premium


Premium


Premium


Premium

Premium


Premium


Premium


Premium


Premium


Premium


Premium

Explore More Free Stock Images