1. Home > 
  2. Stock Photos > 
  3. Innovative Data Visualization in Blue Gradient Background

Innovative Data Visualization in Blue Gradient Background Image

Innovative Data Visualization in Blue Gradient Background

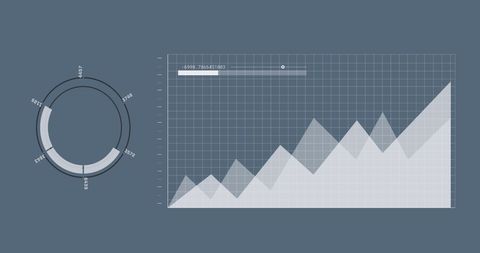
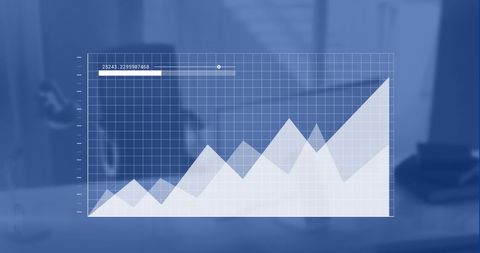
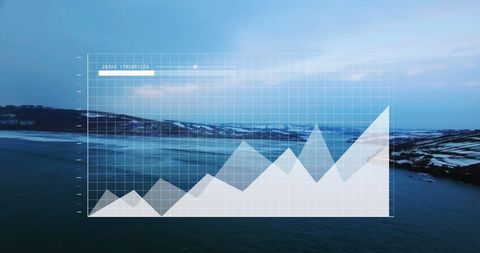
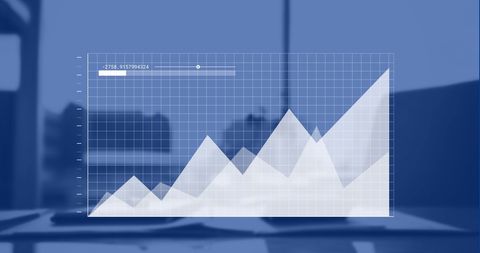
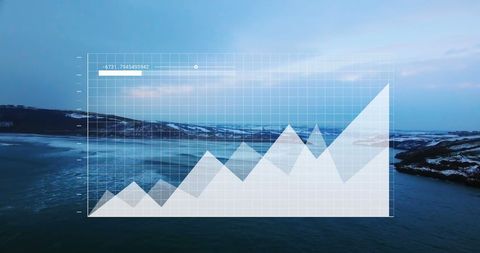
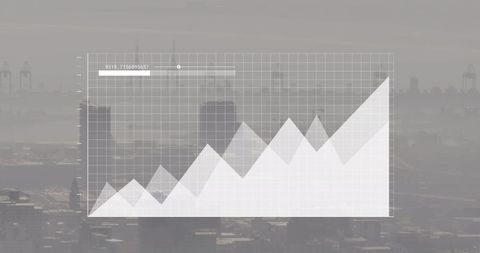
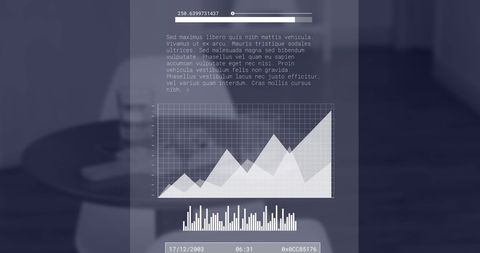
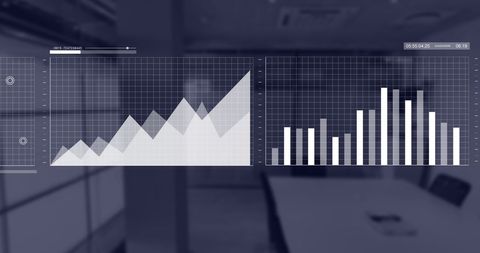
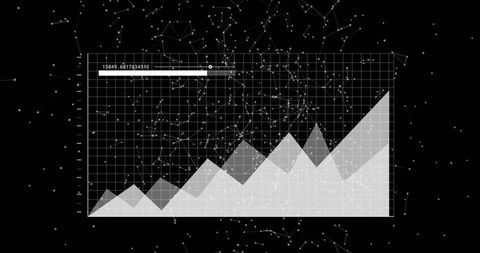
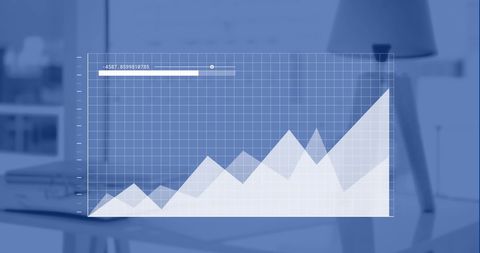
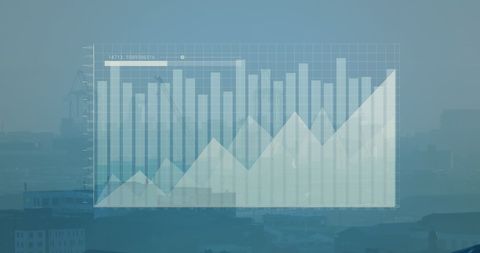
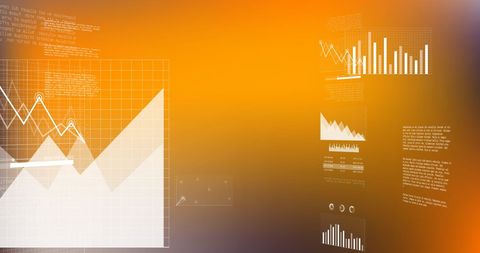
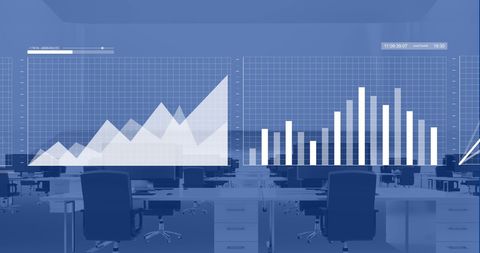
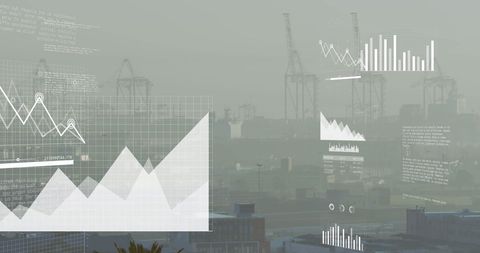
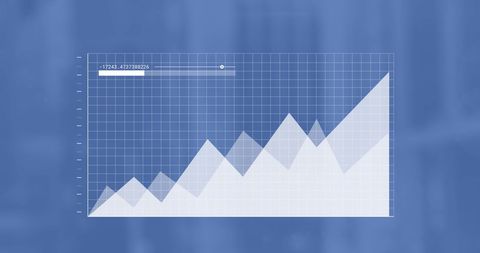
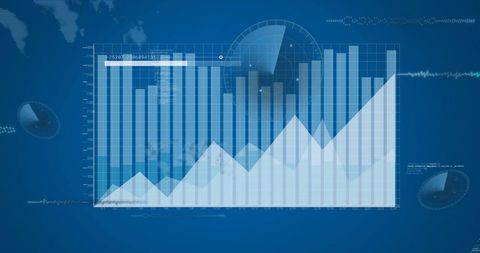
Graph showing upward trend superimposed onto blue-tinted blurred office background. Ideal for illustrating key concepts in business analysis, digital data processing and technology development. Useful for websites, presentations and financial reports where showcasing data analytics and global connections is key for the audience.

Powered by Shutterstock logo - Get 15% off with code: PIKWIZARD15
Man look at the dashboard with graphs and charts. Concept of data management system, business intelligence, data statistics, marketing analysis, key performance indicators (KPI) and analytics. - Powered by Shutterstock - Get 15% off with code: PIKWIZARD15Businesswoman analyzes to chart data business on a visual screen dashboard, technology devices and screens visible in the background, financial planning, market research, and the stock market. - Powered by Shutterstock - Get 15% off with code: PIKWIZARD15Businessman works with financial data. Futuristic 3d interface above laptop computer. Interactive financial diagrams and digital data visualization concept. Global e-business network communication - Powered by Shutterstock - Get 15% off with code: PIKWIZARD15Man look at the dashboard with graphs and charts. Concept of data management system, business intelligence, data statistics, marketing analysis, key performance indicators (KPI) and analytics. - Powered by Shutterstock - Get 15% off with code: PIKWIZARD15Businessman pointing chart financial goals and economic business planning global. - Powered by Shutterstock - Get 15% off with code: PIKWIZARD15

Credit Photo

If you would like to credit the Photo, here are some ways you can do so

Free (free of charge)

Free for personal and commercial use.

Author: Creative Art

Similar Free Stock Images

Cityscape with Digital Financial Data Overlay Inspiration for Global Business
Premium
Hand holding smartphone displays data visualizations, including histogram and pie chart. Analytics, digital transformation and increasing use of mobile technology in business. Minimalist art collage.
Rising Financial Graph with Data Overlay
Digital Data Processing Technology with Global Interface
Abstract Digital Data Processing with Graphical Interface
Financial Data Over Electric Sky Concept for Energy Sector
Premium
A hand interacts with glowing holographic data graphs and charts, showcasing futuristic digital visualization on a dark background. Concept of innovation
Abstract Data Analysis Concept with Gradient Background
Rising Financial Data Chart on Digital Interface
Digital Graph Overlay on Cityscape Visualizing Business Data
Financial Data Processing Overlaid on Office Background
Premium
A professional analyzing business data using a smartphone, displaying analytical charts and AI visuals on a laptop at a modern workspace.
Abstract Data Analysis Dashboard in Modern Office Space
Data Processing Over Computer Servers
Dynamic Graph with Financial Growth Analysis
Digital Data Visualization with Graphs in Business Office
Premium
Displaying dashboard combining line chart, bar chart, donut chart with numeric labels on 3D grid. Analytics, data visualization, digital dashboard, business intelligence, infographics, futuristic
Digital Interface Charts Projected Through Open Doors in Blue Room
Digital Financial Data Charts on Blue Background
Dynamic Financial Data Visualization in Digital Blue
Futuristic Financial Data Interface with Graphs in Data Center
Premium
Futuristic business interface with real-time data analytics on touchscreen, tech presentations, websites, and innovation branding.
Futuristic Financial Data Processing Overlay with Graphs
Digital Data Visualization Over Modern Office Space
Digital Data Processing with Network Interface on Blue Background
Growing Graph in Modern Office Environment
Premium
Displaying financial overlay merging with forest bark and grass, candlestick line charts and gauges. Nature, analytics, data visualization, digital, environment, natural, technology
Abstract Financial Data Analysis on Blue Digital Background
Abstract Financial Chart with Statistics on Yellow Background
Digital Data Graph with Networking Background
Futuristic Data Visualization Rising Line Graph
Digital Data Analysis with Futuristic Charts
Digital Growth Graph Over Winter Landscape
Premium
A close-up view of a hand interacting with a digital tablet displaying various data visualizations, ideal for exploring business analytics and technology.
Abstract Business Data Visualization in Modern Office
Financial Data Processing with Rising Stock Market Graph Overlay
Futuristic Data Analytics Interface with Graphics
Global Financial Data Analysis and Visualization Concept
Premium
Displaying dashboard showing pie, bar, line and candlestick charts with percentage labels on screen. Futuristic, analytics, technology, innovation, data, interface, visualization
Infographic Interface over Cityscape with Financial Data and Statistics
Financial Data Overlay on Cityscape Illustrates Market Trends
Futuristic Graphs Overlay Cityscape Depicting Digital Finance Growth
Financial Data Visualization in Modern Office
Premium
Showing multicolored financial chart on screen, with candlestick bars, line graphs and gridlines. Financial, analytics, data visualization, digital display, market analysis, dashboards, investment
Futuristic Cityscape Merging Technology and Data Visualizations
Digital Financial Data with Interactive Graphs and Charts
Financial Data Charts and Graphs in Office Environment
Modern Financial Data with Graph Display in Office Setting
Premium
Displaying central dotted waveform on holographic dashboard, with gauge, bar charts, numeric labels. Technology, innovation, data, visualization, digital, interface, analytics
Digital Business Graphs with Growth and Analysis Concepts
IT Engineer Analyzing Data in Server Room with Graph Overlay
Growing Data Trends on Gradient Background
Visualizing Financial Data Overlaying AI Conceptual Brain
Premium
Pointing businesswoman wearing blazer showing line graphs and 3D bar charts in tech lab, copy space. Futuristic, analytical, data, visualization, digital, professional, sleek
Digital Data Processing with World Map Background in Office
Futuristic Digital Data Analysis Background with Bar Graphs
Rising Graph in Modern Office, Business Growth Representation
Rising Graph and Data Chart with Office Background
Premium
Displaying waveform streaming data on tech dashboard, with floating panels, gauges and charts. Futuristic, holographic, data visualization, digital interface, technology, innovation, analytics
Data Analytics Interface with Charts on Blue Background
Digital Data Analysis Graphs on Blue Background
Dynamic Data Visualization with Progress and Analytics Chart
Financial Data Analysis on Dark Background Enhancing Insights
Digital Graph Chart Over Snowy Landscape
Digital Graphs and Code Over Blurred Coffee Shop Interior
Premium
Business professional interacting with digital dashboard displaying analytics charts, big data visualization global network map, and performance metrics, representing modern technology, data analysis.
Financial Data Analysis with Global Connectivity Theme
Financial Data Visualization Over Modern Office Environment
Abstract Technology and Business Growth Concept
Aerial View of Data Analytics at Dusk Over Water
Premium
Businessman analysing trading  up trend line graph in bull market, Digital analytics data visualization, financial schedule Currency and Exchange Stock Chart for Finance and Economy Display
Overlay of Financial Graphs in Modern Coffee Shop Environment
Financial Data Analysis on Transparent Grid Background
Advanced Data Analysis with Graphs and Charts Overlay
Financial Data Graph Analyzed Over Urban Landscape
Premium
Displaying glossy red tomatoes on vine on digital display, with blue grid overlay and data charts. Agriculture, technology, data visualization, digital farming, precision agriculture, visual analytics
Financial Graph Projection Over Urban Skyline
Financial Data on Office Desk with Digital Charts
Dynamic Financial Growth Data Visualization Concept
Data Analytics with Virtual Interface on Blue Background
Premium
Professional woman interacting with digital sales dashboard displaying various charts and graphs in modern office
Digital Financial Data Processing with Blue Background
Abstract Financial Data Analysis with Digital Interface Elements
Futuristic Financial Data Interface in Modern Office Environment
Financial Data Analysis with Graph on Black Background
Premium
Businessman working on laptop with futuristic digital dashboard displaying analytics, charts, graphs and statistics for business analytics, big data, financial analysis.
Data Analytics Graph with Modern Digital Interface
Digital Bar Graph Interface Over Empty Office Background
Digital Interface with Data Processing and Graphs
Futuristic Financial Data and Analytics Visualization
Premium
Displaying cyan and red line graphs on left grid screen, showing pink orange labels, copy space. Data visualization, digital analytics, financial charts, modern interface, technical illustration,
Digital Graph Interface Illustrating Financial Data Analysis
Overlay of Digital Analytics Panels in Modern Office
Digital Graph Projection Over Serene Landscape
Digital Interface with Data Chart and Progress Analysis Tools
Digital Data Analysis Over Blue Background
Digital Interface with Data Graph and Circular Scanner
Premium
A business professional interacting with a futuristic digital dashboard displaying analytics charts data visualizations, and performance metrics symbolizing data-driven decisions and modern corporate.
Digital Holographic Business Growth Charts
Financial Analytics with Graphs and Pie Chart on Blue Background
Dynamic Data Visualization with Graphs over Blue Background
Digital Data Interface on Office Desk Monitor in Blue Tones
Premium
marketing, sales, analytics, growth, A hand using a stylus on a tablet displaying analytics charts, representing marketing performance, sales growth, and data-driven decision making.
Business Growth Data Overlay on Urban Architecture Background
Digital Financial Data and Statistics Visualization Concept
Digital Financial Growth Chart on Urban Cityscape Background
Abstract Holographic Business Graphs with World Map Visual
Premium
Displaying candlestick chart in office showing red green candles -73.52 blurred man in suit and tie. Finance, analytics, stocks, data, visualization, digital, gridlines
Digital Financial Chart in Modern Office Environment
Businesswoman Analyzing Financial Growth with Digital Graphs
Digital Data Processing Over Modern Office Desk
Data And Graphs Overlayed on Office Background
Premium
Displaying white user icons on light gray grid charts highlighting blue notification bubble with 58. Analytics, data visualization, digital interface, user engagement, modern design, technology
Abstract Data Visualization in Modern Office Environment
Futuristic Financial Data Overlaid on Modern Office Space
Digital Charts Displaying Data Analytics in Technology Background
Rising Data Graph on Blue Background Depicting Business Success
Premium
Displaying data overlay undulating on dashboard with red and blue charts, percent labels, hex icons. Technology, analytics, innovation, sustainability, data visualization, digital interface, climate
Data Analytics Interface Over Modern Office Workplace
Digital Data Graphs Overlaying Urban Background
Digital Financial Data Processing Over Grid with Global Map
Financial Data Visualization on Blue Graphical Background
Premium
Confident business product owner presenting marketing report on team meeting in boardroom, standing at large electronic screen, pointing at statistic financial data, giving training
Futuristic Blue Analytics Dashboard Displaying Holographic Area and Bar Charts with Global Data Grid