
- Home >
- Stock Photos >
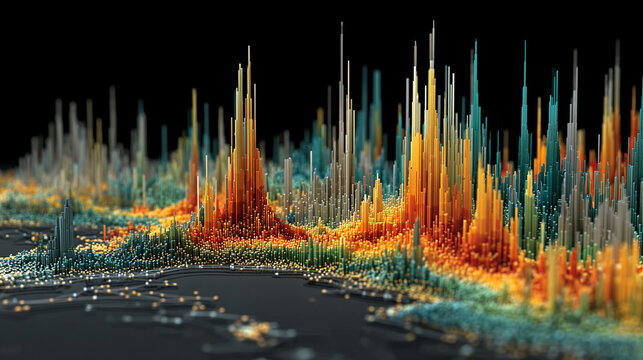
- Innovative Data Visualization Overlaying Digital Head Model
Innovative Data Visualization Overlaying Digital Head Model Image

The convergence of advanced data processing techniques and innovative visualization depicted here suggests its apt use in presentations, business analytics, AI innovations, technical expositions, and academic research projects that explore intersections of medicine and technology. The vivid graph manipulation over scientific head imagery indicates dynamic concepts important for marketing cutting-edge software or technological advancements.
Powered by 


downloads
Tags:
More
Credit Photo
If you would like to credit the Photo, here are some ways you can do so
Text Link
photo Link
<span class="text-link">
<span>
<a target="_blank" href=https://pikwizard.com/photo/innovative-data-visualization-overlaying-digital-head-model/52356793bb1cebf0c45c1e9dcc3e2f6f/>PikWizard</a>
</span>
</span>
<span class="image-link">
<span
style="margin: 0 0 20px 0; display: inline-block; vertical-align: middle; width: 100%;"
>
<a
target="_blank"
href="https://pikwizard.com/photo/innovative-data-visualization-overlaying-digital-head-model/52356793bb1cebf0c45c1e9dcc3e2f6f/"
style="text-decoration: none; font-size: 10px; margin: 0;"
>
<img src="https://pikwizard.com/pw/medium/52356793bb1cebf0c45c1e9dcc3e2f6f.jpg" style="margin: 0; width: 100%;" alt="" />
<p style="font-size: 12px; margin: 0;">PikWizard</p>
</a>
</span>
</span>
Free (free of charge)
Free for personal and commercial use.
Author: Awesome Content
Similar Free Stock Images

Premium


Premium

Premium


Premium


Premium


Premium


Premium

Premium

Premium


Premium


Premium


Premium


Premium


Premium

Premium

Premium


Premium


Premium


Premium


Premium


Premium


Premium

Premium


Premium


Premium


Explore More Free Stock Images