
- Home >
- Stock Photos >
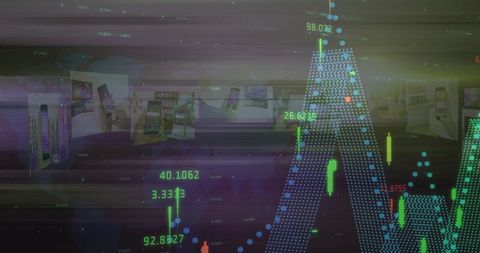
- Innovative Data Visualization with Market Trends Analysis
Innovative Data Visualization with Market Trends Analysis Image

This abstract representation illustrates the dynamic interplay between technology and finance, showcasing candlestick charts and numeric overlays on a futuristic digital interface. Perfect for demonstrating concepts related to analytics, data-driven decision making, or innovative financial practices and technology services. Useful for presentations, technology blogs, or finance sector marketing materials.
Powered by 


downloads
Tags:
More
Credit Photo
If you would like to credit the Photo, here are some ways you can do so
Text Link
photo Link
<span class="text-link">
<span>
<a target="_blank" href=https://pikwizard.com/photo/innovative-data-visualization-with-market-trends-analysis/2e31c6516bb57ba43fc27a794afa9e29/>PikWizard</a>
</span>
</span>
<span class="image-link">
<span
style="margin: 0 0 20px 0; display: inline-block; vertical-align: middle; width: 100%;"
>
<a
target="_blank"
href="https://pikwizard.com/photo/innovative-data-visualization-with-market-trends-analysis/2e31c6516bb57ba43fc27a794afa9e29/"
style="text-decoration: none; font-size: 10px; margin: 0;"
>
<img src="https://pikwizard.com/pw/medium/2e31c6516bb57ba43fc27a794afa9e29.jpg" style="margin: 0; width: 100%;" alt="" />
<p style="font-size: 12px; margin: 0;">PikWizard</p>
</a>
</span>
</span>
Free (free of charge)
Free for personal and commercial use.
Author: Authentic Images
Similar Free Stock Images

Premium


Premium


Premium


Premium


Premium


Premium


Premium

Premium


Premium


Premium


Premium

Premium

Premium


Premium

Premium


Premium

Premium


Premium

Premium


Premium


Premium

Premium

Premium

Premium


Premium


Explore More Free Stock Images