- Home >
- Stock Photos >
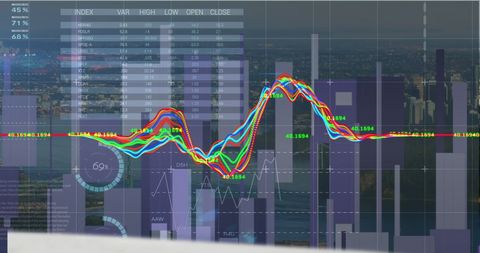
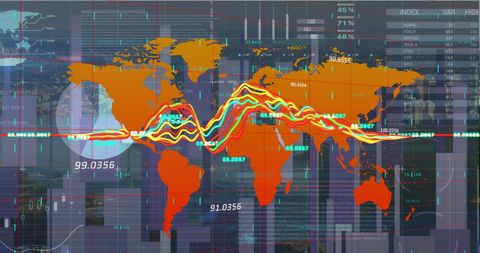
- Innovative Data Visualization with Multicolored Line Graph on Trading Dashboard
Innovative Data Visualization with Multicolored Line Graph on Trading Dashboard Image

Multicolored line graph display on trading dashboard highlights financial analytics and complexities of trading data. Candlestick bars and pie segments contrast against a digital interface, representing diverse investment metrics. Ideal for concepts in modern finance, business technology, innovation, and digital analytics strategies.

downloads
Tags:
More
Credit Photo
If you would like to credit the Photo, here are some ways you can do so
Text Link
photo Link
<span class="text-link">
<span>
<a target="_blank" href=https://pikwizard.com/photo/innovative-data-visualization-with-multicolored-line-graph-on-trading-dashboard/e1ddd3659a5d8f9930880e58c5ca5023/>PikWizard</a>
</span>
</span>
<span class="image-link">
<span
style="margin: 0 0 20px 0; display: inline-block; vertical-align: middle; width: 100%;"
>
<a
target="_blank"
href="https://pikwizard.com/photo/innovative-data-visualization-with-multicolored-line-graph-on-trading-dashboard/e1ddd3659a5d8f9930880e58c5ca5023/"
style="text-decoration: none; font-size: 10px; margin: 0;"
>
<img src="https://pikwizard.com/pw/medium/e1ddd3659a5d8f9930880e58c5ca5023.jpg" style="margin: 0; width: 100%;" alt="" />
<p style="font-size: 12px; margin: 0;">PikWizard</p>
</a>
</span>
</span>
Free (free of charge)
Free for personal and commercial use.
Author: Authentic Images