- Home >
- Stock Photos >
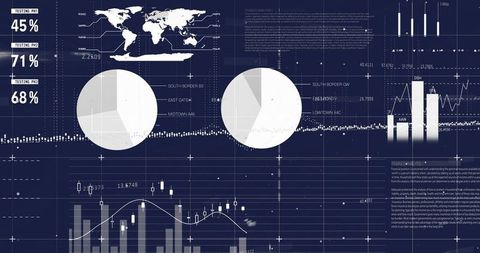
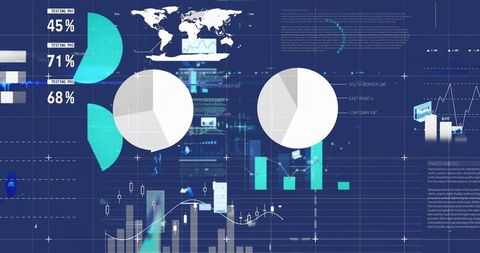
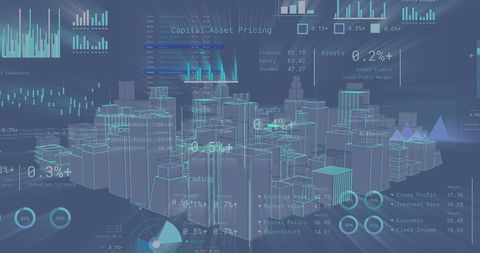
- Innovative Data Visualization with Tech Interface for Analytics
Innovative Data Visualization with Tech Interface for Analytics Image

This compelling scene featuring digital analytics offers visuals perfect for platforms related to technology, data analysis, and scientific research. With fluctuating bar graphs encompassed within crypto-coded visuals, use it to emphasize messages on data innovation and disruptive tech paradigms.

downloads
Tags:
More
Credit Photo
If you would like to credit the Photo, here are some ways you can do so
Text Link
photo Link
<span class="text-link">
<span>
<a target="_blank" href=https://pikwizard.com/photo/innovative-data-visualization-with-tech-interface-for-analytics/5b01bba22f96c17245e8748ae6979da9/>PikWizard</a>
</span>
</span>
<span class="image-link">
<span
style="margin: 0 0 20px 0; display: inline-block; vertical-align: middle; width: 100%;"
>
<a
target="_blank"
href="https://pikwizard.com/photo/innovative-data-visualization-with-tech-interface-for-analytics/5b01bba22f96c17245e8748ae6979da9/"
style="text-decoration: none; font-size: 10px; margin: 0;"
>
<img src="https://pikwizard.com/pw/medium/5b01bba22f96c17245e8748ae6979da9.jpg" style="margin: 0; width: 100%;" alt="" />
<p style="font-size: 12px; margin: 0;">PikWizard</p>
</a>
</span>
</span>
Free (free of charge)
Free for personal and commercial use.
Author: Awesome Content