
- Home >
- Stock Photos >
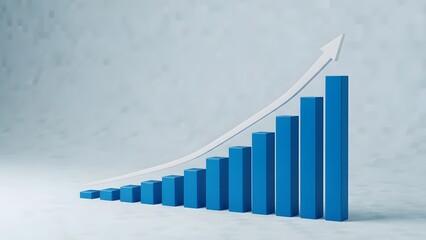
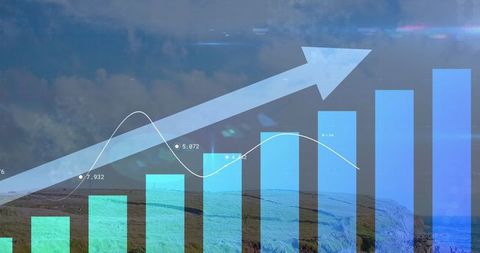
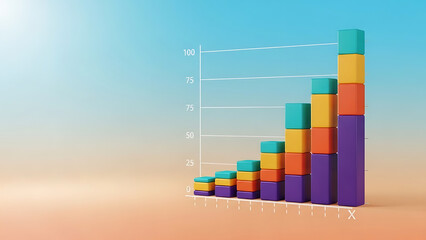
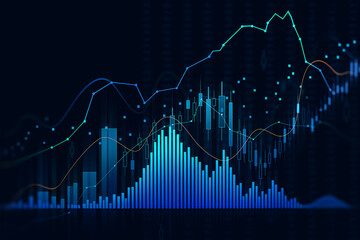
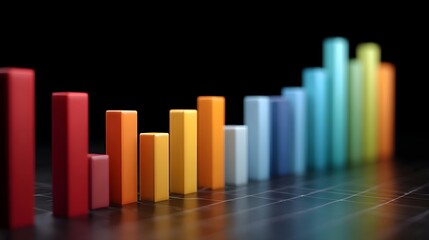
- Innovative Data Visualization with Upward Trend Bar Chart
Innovative Data Visualization with Upward Trend Bar Chart Image

Colorful digital bar chart displaying an upward trend, ideal for futures in business analyses showcasing growth or projections. This visualization encapsulates a dynamic integration of data points, with a focus on innovation and technology, perfectly suited for backgrounds in tech-oriented presentations, data-driven reports, and analytical articles.
Powered by 


downloads
Tags:
More
Credit Photo
If you would like to credit the Photo, here are some ways you can do so
Text Link
photo Link
<span class="text-link">
<span>
<a target="_blank" href=https://pikwizard.com/photo/innovative-data-visualization-with-upward-trend-bar-chart/8b929f2aa5e0cbf48becf42685669621/>PikWizard</a>
</span>
</span>
<span class="image-link">
<span
style="margin: 0 0 20px 0; display: inline-block; vertical-align: middle; width: 100%;"
>
<a
target="_blank"
href="https://pikwizard.com/photo/innovative-data-visualization-with-upward-trend-bar-chart/8b929f2aa5e0cbf48becf42685669621/"
style="text-decoration: none; font-size: 10px; margin: 0;"
>
<img src="https://pikwizard.com/pw/medium/8b929f2aa5e0cbf48becf42685669621.jpg" style="margin: 0; width: 100%;" alt="" />
<p style="font-size: 12px; margin: 0;">PikWizard</p>
</a>
</span>
</span>
Free (free of charge)
Free for personal and commercial use.
Author: Awesome Content
Similar Free Stock Images

Premium

Premium
Premium


Premium


Premium


Premium


Premium


Premium


Premium


Premium


Premium


Premium


Premium
Premium


Premium


Premium
Premium


Premium


Premium


Premium


Premium


Premium


Premium


Premium


Premium


Explore More Free Stock Images