
- Home >
- Stock Photos >
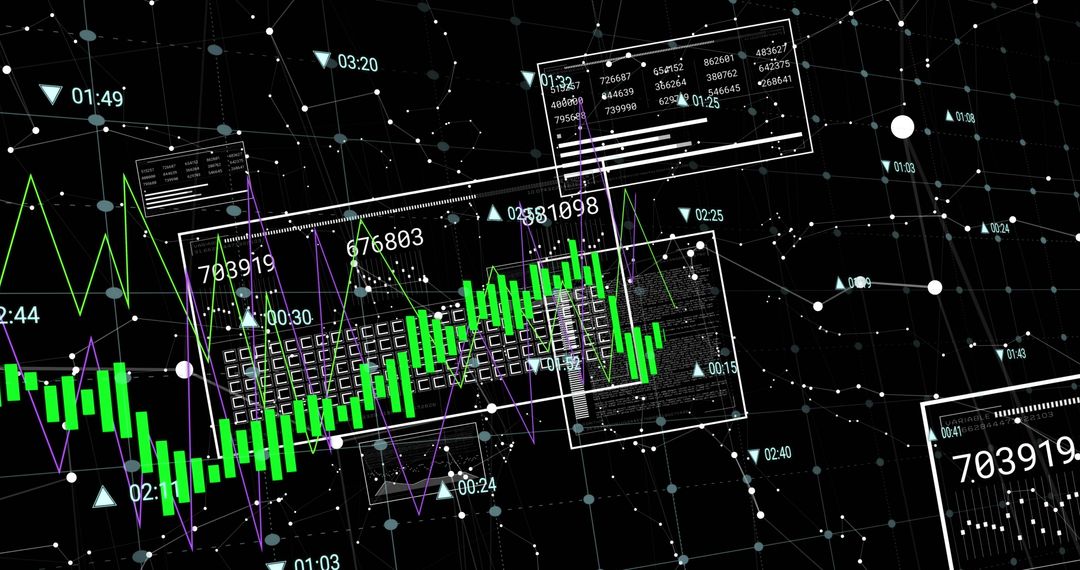
- Innovative Digital Finance Data Display on Dark Interface
Innovative Digital Finance Data Display on Dark Interface Image

Illustrating financial data processing on a dark digital backdrop, highlighting complex stock market trends and analytical computations. Ideal for conveying themes of modern finance, investing, market predictions, or for technology and data-driven projects.
Powered by 


2
downloads
downloads
Tags:
More
Credit Photo
If you would like to credit the Photo, here are some ways you can do so
Text Link
photo Link
<span class="text-link">
<span>
<a target="_blank" href=https://pikwizard.com/photo/innovative-digital-finance-data-display-on-dark-interface/5b580bf816564139cf2724b28f8fea96/>PikWizard</a>
</span>
</span>
<span class="image-link">
<span
style="margin: 0 0 20px 0; display: inline-block; vertical-align: middle; width: 100%;"
>
<a
target="_blank"
href="https://pikwizard.com/photo/innovative-digital-finance-data-display-on-dark-interface/5b580bf816564139cf2724b28f8fea96/"
style="text-decoration: none; font-size: 10px; margin: 0;"
>
<img src="https://pikwizard.com/pw/medium/5b580bf816564139cf2724b28f8fea96.jpg" style="margin: 0; width: 100%;" alt="" />
<p style="font-size: 12px; margin: 0;">PikWizard</p>
</a>
</span>
</span>
Free (free of charge)
Free for personal and commercial use.
Author: Authentic Images
Similar Free Stock Images

Premium


Premium


Premium


Premium


Premium


Premium


Premium


Premium


Premium


Premium


Premium


Premium


Premium


Premium


Premium


Premium


Premium


Premium


Premium


Premium


Premium


Premium


Premium


Premium

