- Home >
- Stock Photos >
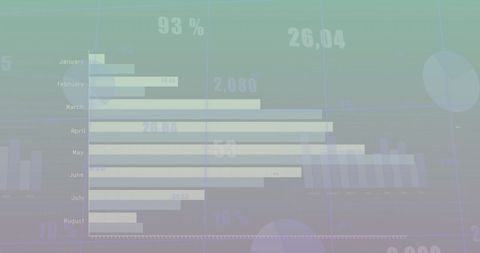
- Innovative Digital Monthly Growth Chart Background for Data Analysis
Innovative Digital Monthly Growth Chart Background for Data Analysis Image

Visual representation of monthly growth data with a sleek, digital design emphasizing data analytics and business forecasting. Ideal for use in presentations, business reports, digital marketing materials, and analytical software interfaces to illustrate trends and data insights stylishly.

downloads
Tags:
More
Credit Photo
If you would like to credit the Photo, here are some ways you can do so
Text Link
photo Link
<span class="text-link">
<span>
<a target="_blank" href=https://pikwizard.com/photo/innovative-digital-monthly-growth-chart-background-for-data-analysis/fe7453d2e829f110e832eb852be23cba/>PikWizard</a>
</span>
</span>
<span class="image-link">
<span
style="margin: 0 0 20px 0; display: inline-block; vertical-align: middle; width: 100%;"
>
<a
target="_blank"
href="https://pikwizard.com/photo/innovative-digital-monthly-growth-chart-background-for-data-analysis/fe7453d2e829f110e832eb852be23cba/"
style="text-decoration: none; font-size: 10px; margin: 0;"
>
<img src="https://pikwizard.com/pw/medium/fe7453d2e829f110e832eb852be23cba.jpg" style="margin: 0; width: 100%;" alt="" />
<p style="font-size: 12px; margin: 0;">PikWizard</p>
</a>
</span>
</span>
Free (free of charge)
Free for personal and commercial use.
Author: Creative Art