- Home >
- Stock Photos >
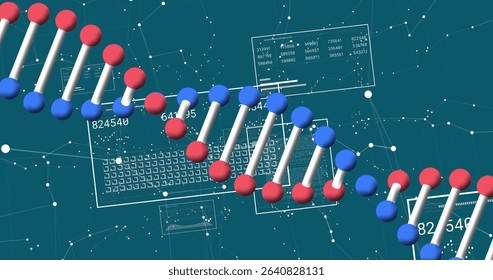
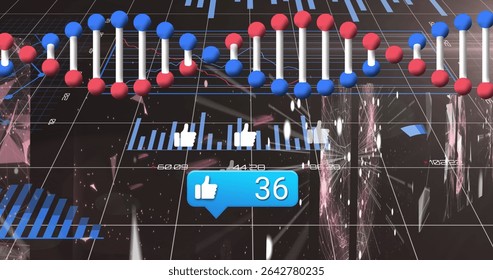
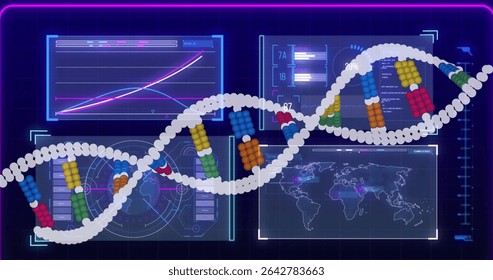
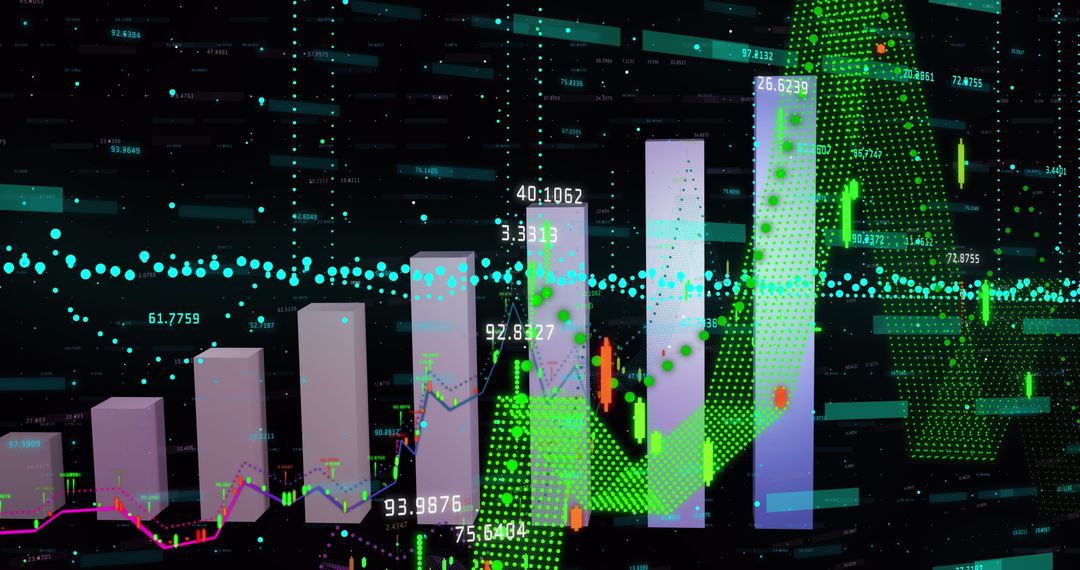
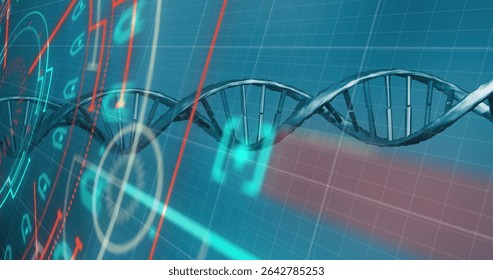
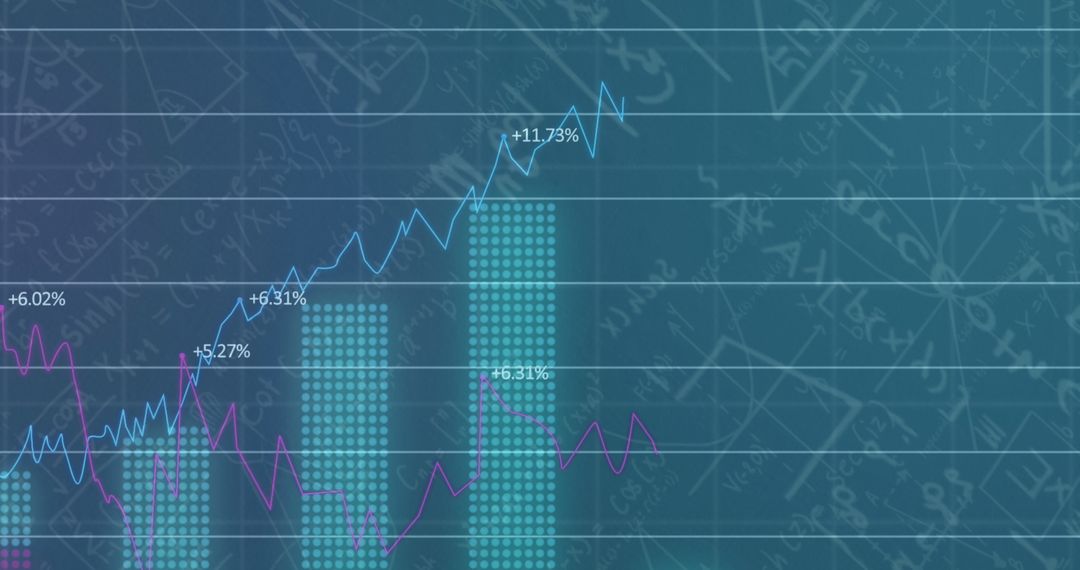
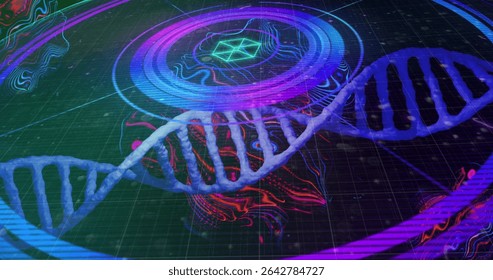
- Innovative DNA Visualization with Bar Charts and Line Graphs
Innovative DNA Visualization with Bar Charts and Line Graphs Image
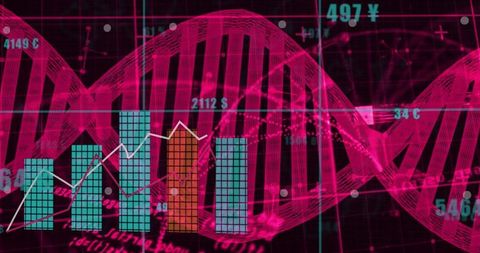
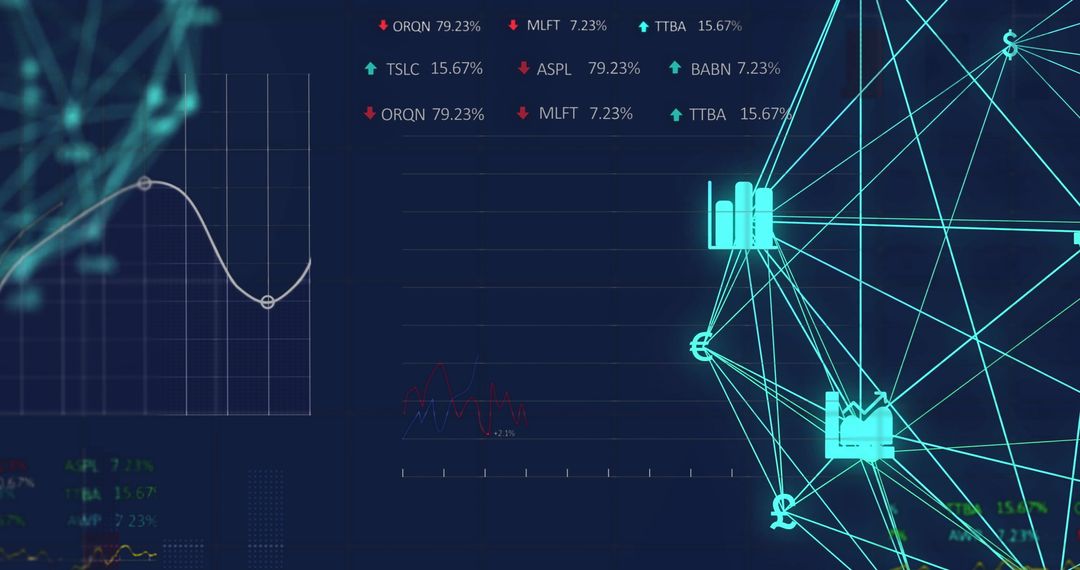
Red DNA helix intersects digital interface with overlaid bar charts and line graphs on dark background, epitomizing join of genetic science and data technology. Suitable for biotechnology projects, scientific presentations, genetics workshops, and tech seminars, it effectively conveys innovation and analytical thinking.
Powered by  - Get 15% off with code: PIKWIZARD15


2
downloads
downloads
Tags:
More
Credit Photo
If you would like to credit the Photo, here are some ways you can do so
Text Link
photo Link
<span class="text-link">
<span>
<a target="_blank" href=https://pikwizard.com/photo/innovative-dna-visualization-with-bar-charts-and-line-graphs/0d8751428d047ceb91906a2e69986e52/>PikWizard</a>
</span>
</span>
<span class="image-link">
<span
style="margin: 0 0 20px 0; display: inline-block; vertical-align: middle; width: 100%;"
>
<a
target="_blank"
href="https://pikwizard.com/photo/innovative-dna-visualization-with-bar-charts-and-line-graphs/0d8751428d047ceb91906a2e69986e52/"
style="text-decoration: none; font-size: 10px; margin: 0;"
>
<img src="https://pikwizard.com/pw/medium/0d8751428d047ceb91906a2e69986e52.jpg" style="margin: 0; width: 100%;" alt="" />
<p style="font-size: 12px; margin: 0;">PikWizard</p>
</a>
</span>
</span>
Free (free of charge)
Free for personal and commercial use.
Author: Awesome Content
Similar Free Stock Images

Premium


Premium


Premium


Premium


Premium


Premium


Premium


Premium


Premium


Premium


Premium


Premium


Premium


Premium


Premium


Premium


Premium


Premium


Premium


Premium


Premium


Premium


Premium


Premium