
- Home >
- Stock Photos >
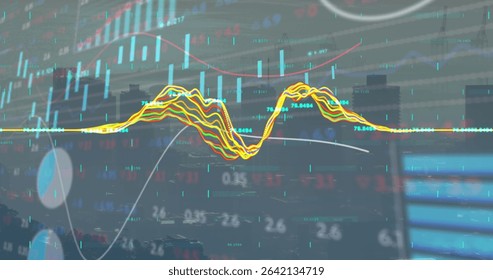
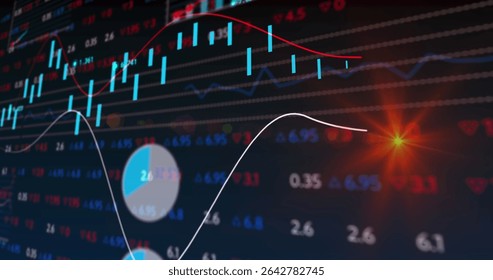
- Innovative Financial Dashboard with Dynamic Pie Chart and Data Analysis
Innovative Financial Dashboard with Dynamic Pie Chart and Data Analysis Image

This image depicts a modern financial dashboard with a translucent pie chart overlay, enhanced by candlestick chart elements. It symbolizes the intersection of finance and technology, showcasing how visual analytics streamline data interpretation for businesses. Perfect for illustrating articles or presentations about financial analysis, business intelligence tools, or technology-driven decision making.
Powered by  - Get 15% off with code: PIKWIZARD15


downloads
Tags:
More
Credit Photo
If you would like to credit the Photo, here are some ways you can do so
Text Link
photo Link
<span class="text-link">
<span>
<a target="_blank" href=https://pikwizard.com/photo/innovative-financial-dashboard-with-dynamic-pie-chart-and-data-analysis/ffb6fd4d112dd047dfe6d243718d7d11/>PikWizard</a>
</span>
</span>
<span class="image-link">
<span
style="margin: 0 0 20px 0; display: inline-block; vertical-align: middle; width: 100%;"
>
<a
target="_blank"
href="https://pikwizard.com/photo/innovative-financial-dashboard-with-dynamic-pie-chart-and-data-analysis/ffb6fd4d112dd047dfe6d243718d7d11/"
style="text-decoration: none; font-size: 10px; margin: 0;"
>
<img src="https://pikwizard.com/pw/medium/ffb6fd4d112dd047dfe6d243718d7d11.jpg" style="margin: 0; width: 100%;" alt="" />
<p style="font-size: 12px; margin: 0;">PikWizard</p>
</a>
</span>
</span>
Free (free of charge)
Free for personal and commercial use.
Author: Creative Art
Similar Free Stock Images

Premium


Premium

Premium


Premium


Premium


Premium


Premium


Premium

Premium


Premium


Premium


Premium


Premium


Premium


Premium


Premium


Premium

Premium

Premium

Premium


Premium

Premium


Premium


Premium

Premium


Explore More Free Stock Images