
- Home >
- Stock Photos >
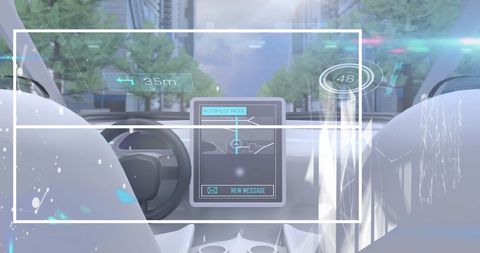
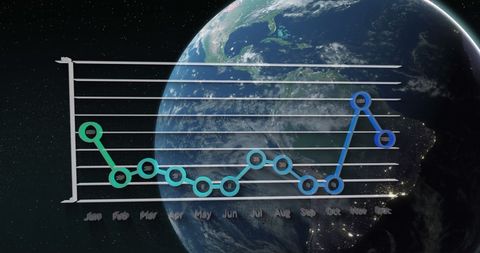
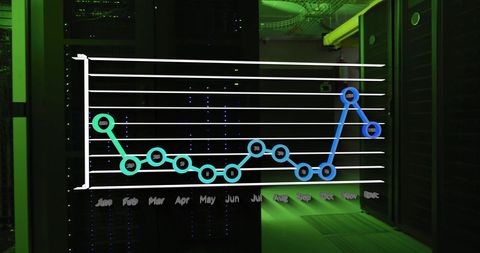
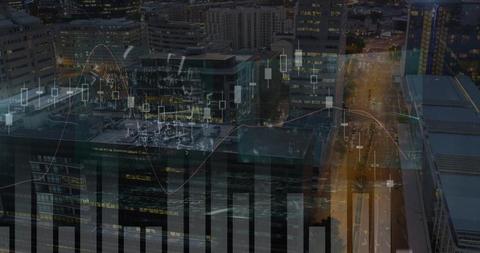
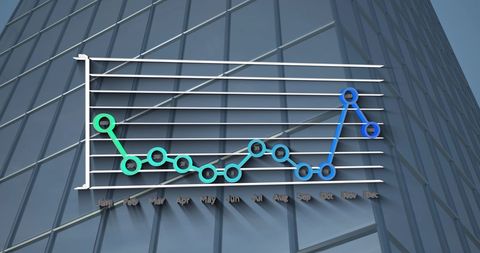
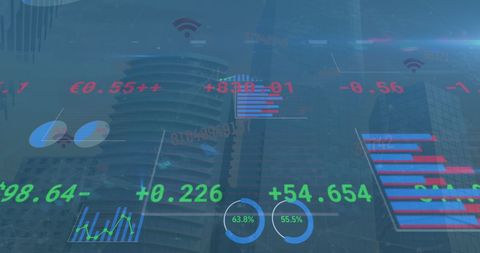
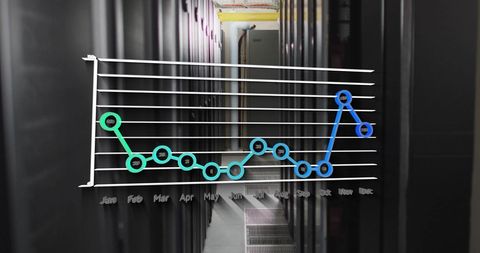
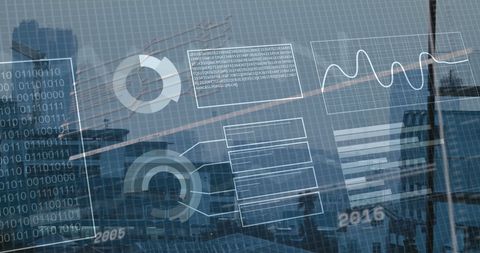
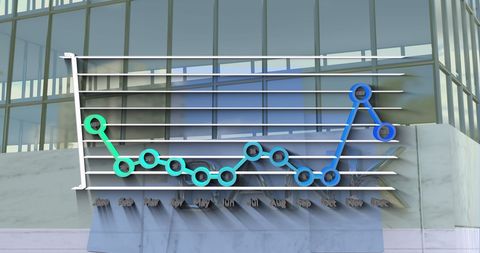
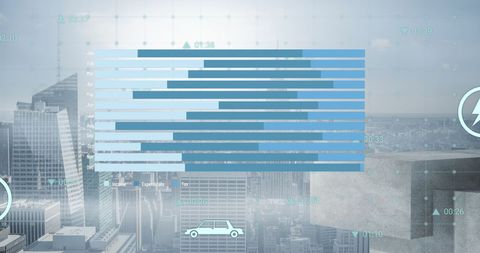
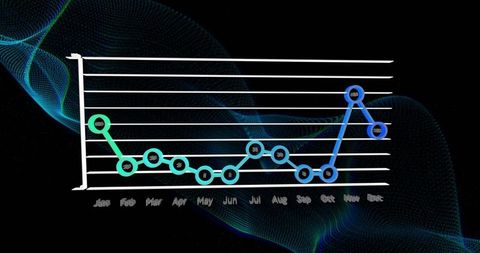
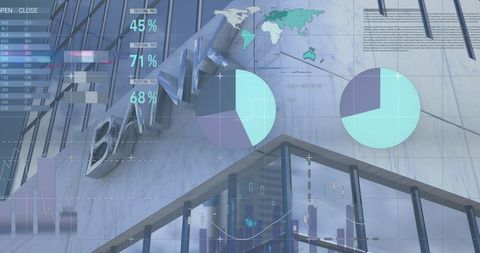
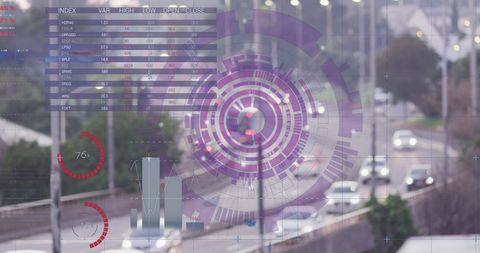
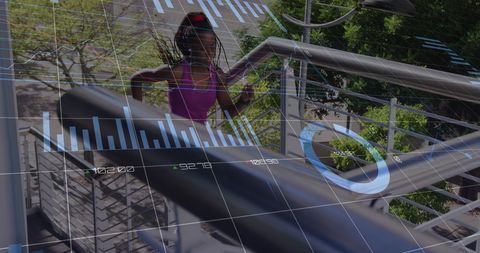
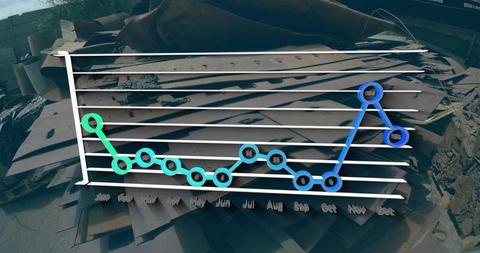
- Innovative Financial Data Visualization in Car Technology Interface
Innovative Financial Data Visualization in Car Technology Interface Image
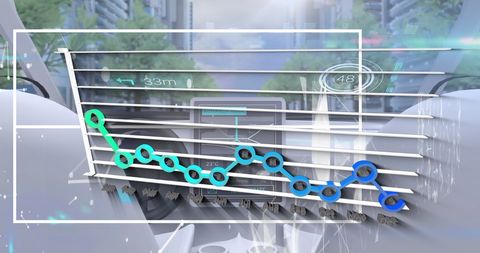
Visual displays merging automotive technology with digital financial analysis provide a futuristic look into data integration. Helpful for presentations on the future of car interfaces or technological advancements in business analytics.
Powered by 


downloads
Tags:
More
Credit Photo
If you would like to credit the Photo, here are some ways you can do so
Text Link
photo Link
<span class="text-link">
<span>
<a target="_blank" href=https://pikwizard.com/photo/innovative-financial-data-visualization-in-car-technology-interface/ea9ef98ed661b107e7dd827804b9538e/>PikWizard</a>
</span>
</span>
<span class="image-link">
<span
style="margin: 0 0 20px 0; display: inline-block; vertical-align: middle; width: 100%;"
>
<a
target="_blank"
href="https://pikwizard.com/photo/innovative-financial-data-visualization-in-car-technology-interface/ea9ef98ed661b107e7dd827804b9538e/"
style="text-decoration: none; font-size: 10px; margin: 0;"
>
<img src="https://pikwizard.com/pw/medium/ea9ef98ed661b107e7dd827804b9538e.jpg" style="margin: 0; width: 100%;" alt="" />
<p style="font-size: 12px; margin: 0;">PikWizard</p>
</a>
</span>
</span>
Free (free of charge)
Free for personal and commercial use.
Author: Awesome Content
Similar Free Stock Images
Premium


Premium


Premium


Premium

Premium

Premium


Premium


Premium


Premium


Premium


Premium

Premium


Premium


Premium


Premium


Premium


Premium


Premium


Premium


Premium

Premium


Premium


Premium

Premium


Premium


Explore More Free Stock Images