
- Home >
- Stock Photos >
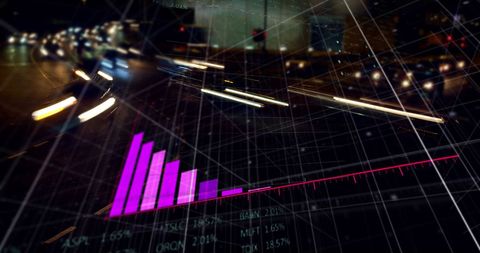
- Innovative Graph Analyzing Data Over Vibrant Cityscape
Innovative Graph Analyzing Data Over Vibrant Cityscape Image

This visually striking representation of graph data analysis superimposed on a cityscape at night highlights global business and the integration of technology. The vibrant city lights symbolize advanced financial markets and innovative methods. Ideal for use in presentations, articles, or any project focused on finance, data analytics, or future technology landscapes.
Powered by 


downloads
Tags:
More
Credit Photo
If you would like to credit the Photo, here are some ways you can do so
Text Link
photo Link
<span class="text-link">
<span>
<a target="_blank" href=https://pikwizard.com/photo/innovative-graph-analyzing-data-over-vibrant-cityscape/accb7c5836a42db974308bfebfef2556/>PikWizard</a>
</span>
</span>
<span class="image-link">
<span
style="margin: 0 0 20px 0; display: inline-block; vertical-align: middle; width: 100%;"
>
<a
target="_blank"
href="https://pikwizard.com/photo/innovative-graph-analyzing-data-over-vibrant-cityscape/accb7c5836a42db974308bfebfef2556/"
style="text-decoration: none; font-size: 10px; margin: 0;"
>
<img src="https://pikwizard.com/pw/medium/accb7c5836a42db974308bfebfef2556.jpg" style="margin: 0; width: 100%;" alt="" />
<p style="font-size: 12px; margin: 0;">PikWizard</p>
</a>
</span>
</span>
Free (free of charge)
Free for personal and commercial use.
Author: People Creations
Similar Free Stock Images

Premium


Premium


Premium


Premium


Premium


Premium


Premium


Premium

Premium


Premium

Premium


Premium


Premium


Premium


Premium

Premium


Premium


Premium


Premium


Premium


Premium


Premium


Premium


Premium


Premium


Explore More Free Stock Images