
- Home >
- Stock Photos >
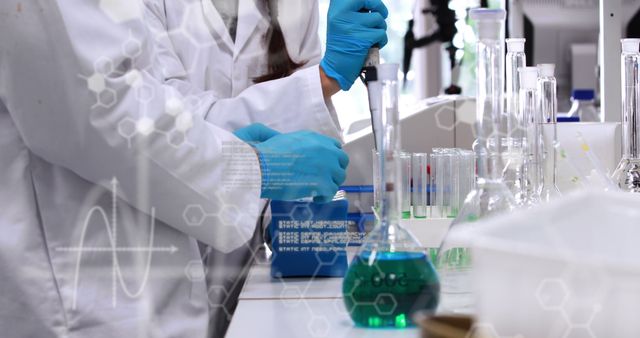
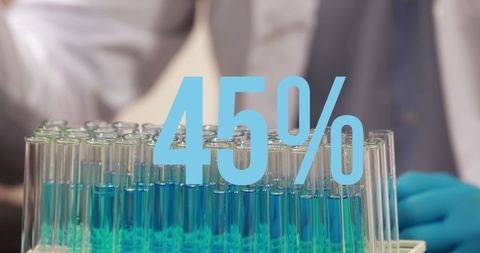
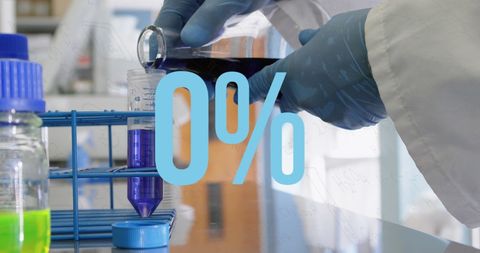
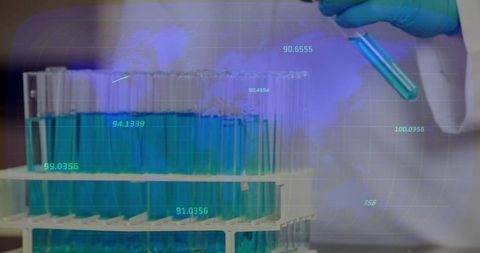
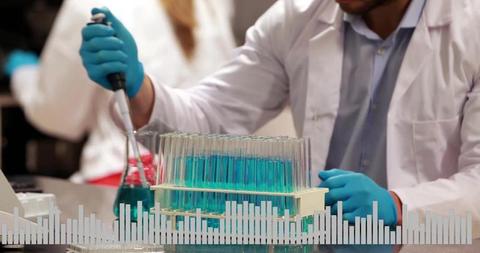
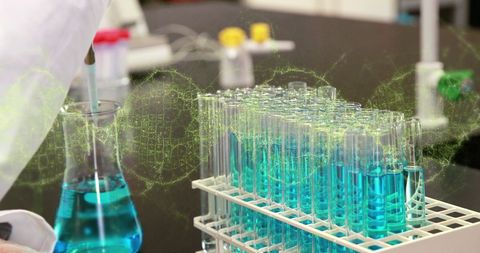
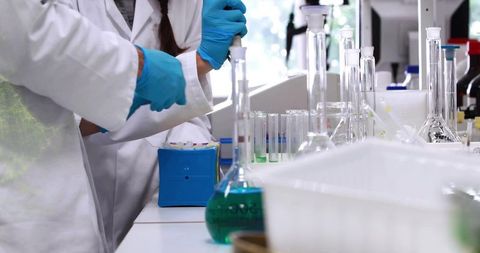
- Innovative Scientific Analysis with Test Tubes and Data Visualization
Innovative Scientific Analysis with Test Tubes and Data Visualization Image
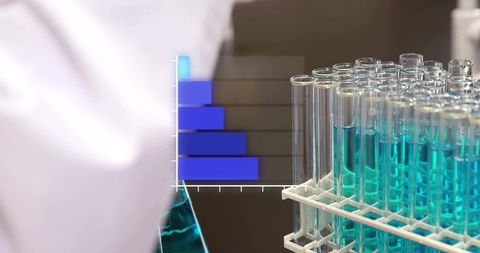
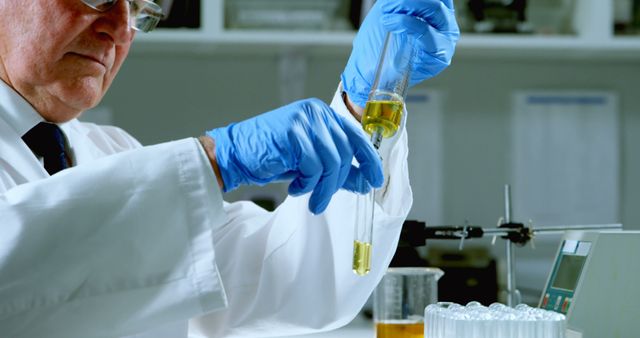
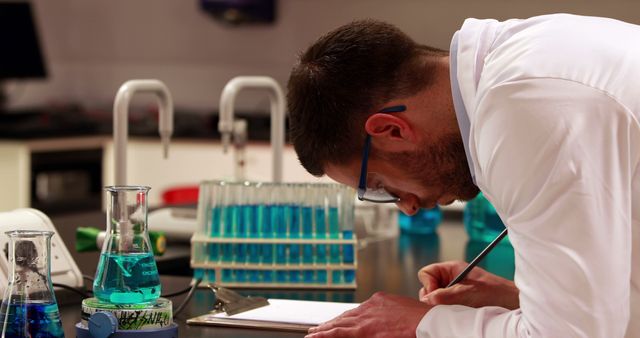
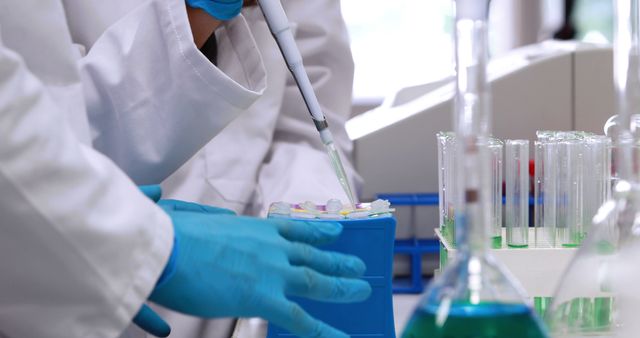
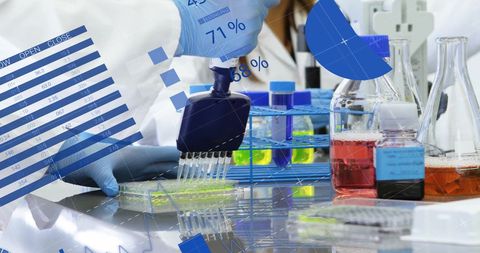
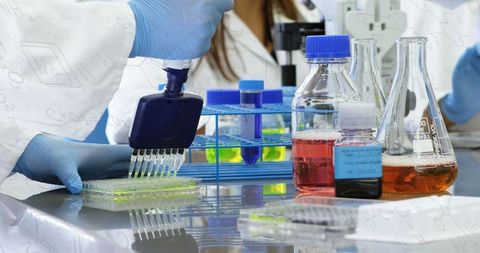
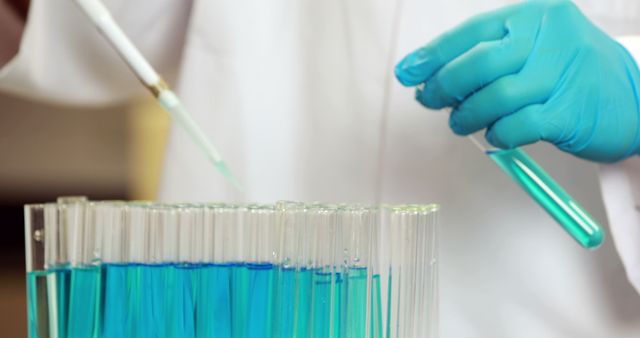
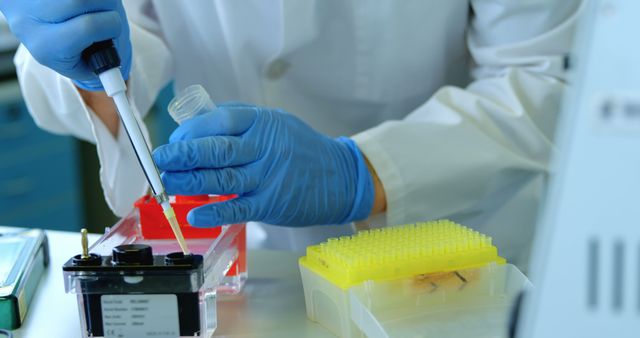
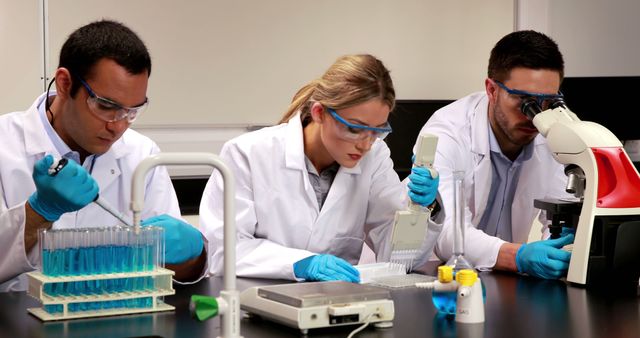
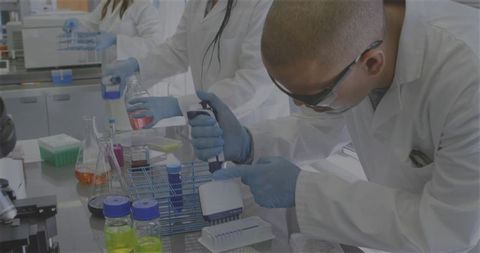
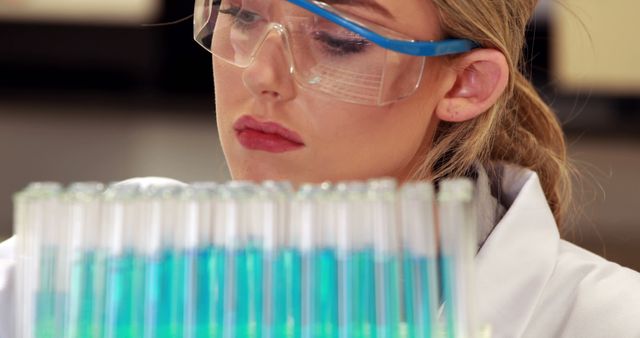
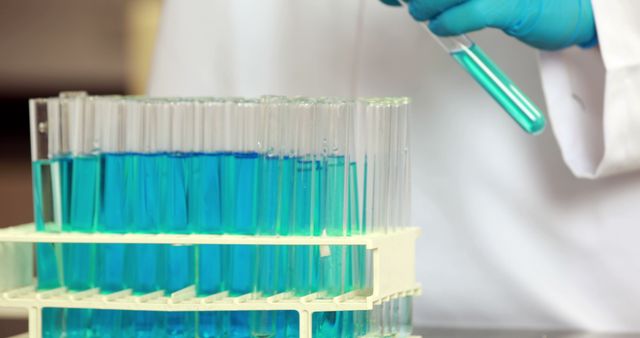
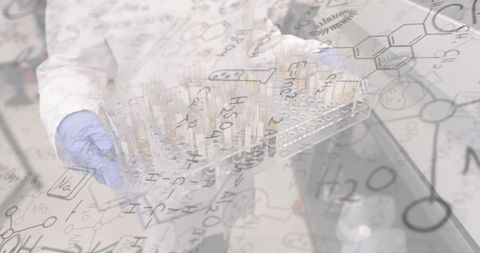
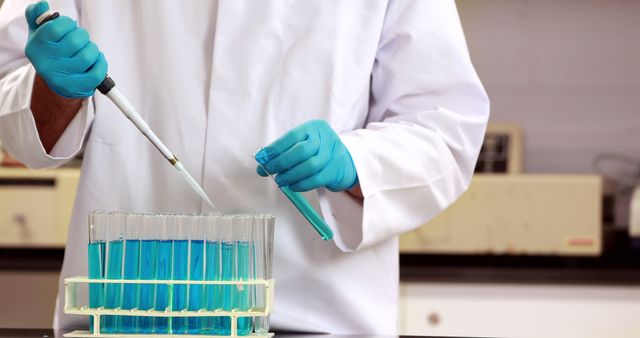
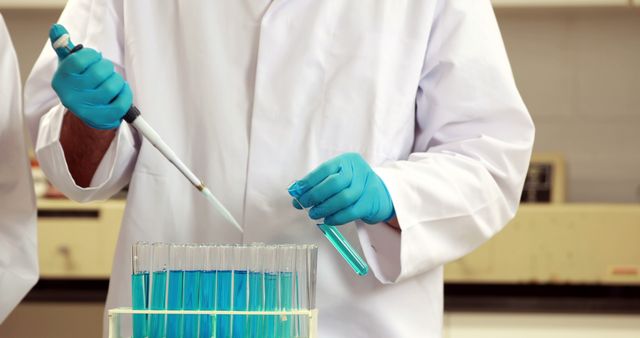
Scientist is analyzing scientific data with a bar chart over test tubes filled with blue liquid, symbolizing the integration of data analytics in lab experiments. Useful for illustrating themes about modern scientific research, the use of data visualization in laboratories, or concepts in biotechnology and pharmaceuticals.
Powered by 


downloads
Tags:
More
Credit Photo
If you would like to credit the Photo, here are some ways you can do so
Text Link
photo Link
<span class="text-link">
<span>
<a target="_blank" href=https://pikwizard.com/photo/innovative-scientific-analysis-with-test-tubes-and-data-visualization/0ccb4af33436fb221d54975cfd960f12/>PikWizard</a>
</span>
</span>
<span class="image-link">
<span
style="margin: 0 0 20px 0; display: inline-block; vertical-align: middle; width: 100%;"
>
<a
target="_blank"
href="https://pikwizard.com/photo/innovative-scientific-analysis-with-test-tubes-and-data-visualization/0ccb4af33436fb221d54975cfd960f12/"
style="text-decoration: none; font-size: 10px; margin: 0;"
>
<img src="https://pikwizard.com/pw/medium/0ccb4af33436fb221d54975cfd960f12.jpg" style="margin: 0; width: 100%;" alt="" />
<p style="font-size: 12px; margin: 0;">PikWizard</p>
</a>
</span>
</span>
Free (free of charge)
Free for personal and commercial use.
Author: Creative Art
Similar Free Stock Images

Premium

Premium


Premium


Premium


Premium


Premium


Premium


Premium


Premium


Premium

Premium


Premium

Premium


Premium

Premium

Premium


Premium


Premium


Premium


Premium

Premium

Premium


Premium


Premium

Premium

Explore More Free Stock Images