- Home >
- Stock Photos >
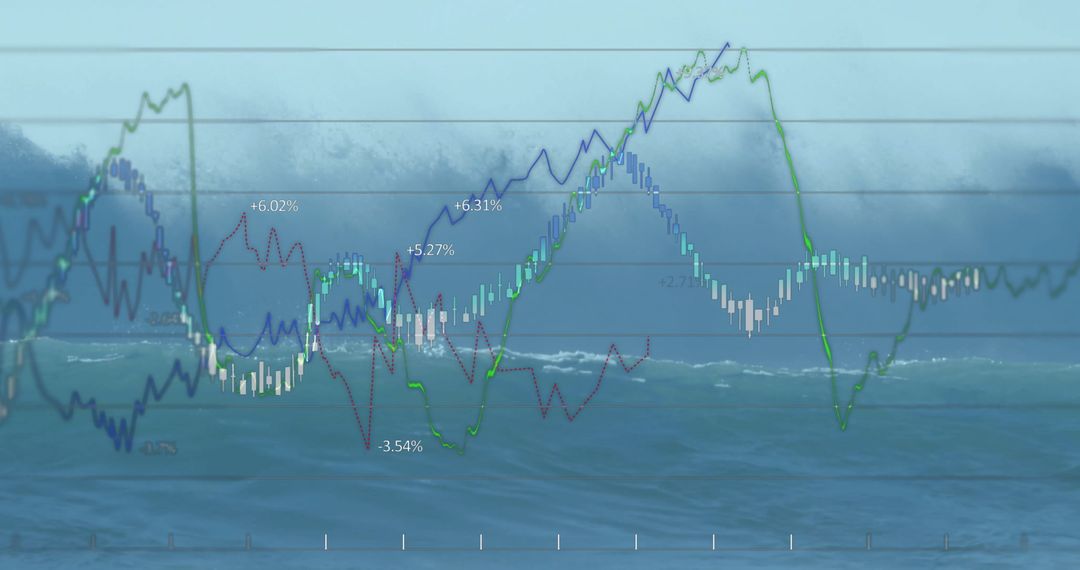
- Innovative Stock Market Analysis Illustration with Digital Graphs
Innovative Stock Market Analysis Illustration with Digital Graphs Image

High-tech portrayal of stock market movements, ideal for use in presentations on investment strategies, digital finance publications, and financial analysis tutorials. Bold visuals convey dynamic financial environments, providing a modern look for websites, blog posts, and educational materials requiring illustrative concepts in the world of stock trading and finance data.
Powered by 


2
downloads
downloads
Tags:
More
Credit Photo
If you would like to credit the Photo, here are some ways you can do so
Text Link
photo Link
<span class="text-link">
<span>
<a target="_blank" href=https://pikwizard.com/photo/innovative-stock-market-analysis-illustration-with-digital-graphs/60dd5b0ef5ee63d8ebb20886b50a85c9/>PikWizard</a>
</span>
</span>
<span class="image-link">
<span
style="margin: 0 0 20px 0; display: inline-block; vertical-align: middle; width: 100%;"
>
<a
target="_blank"
href="https://pikwizard.com/photo/innovative-stock-market-analysis-illustration-with-digital-graphs/60dd5b0ef5ee63d8ebb20886b50a85c9/"
style="text-decoration: none; font-size: 10px; margin: 0;"
>
<img src="https://pikwizard.com/pw/medium/60dd5b0ef5ee63d8ebb20886b50a85c9.jpg" style="margin: 0; width: 100%;" alt="" />
<p style="font-size: 12px; margin: 0;">PikWizard</p>
</a>
</span>
</span>
Free (free of charge)
Free for personal and commercial use.
Author: Authentic Images
Similar Free Stock Images

Premium


Premium


Premium


Premium


Premium


Premium


Premium


Premium


Premium


Premium


Premium


Premium


Premium


Premium


Premium


Premium


Premium


Premium


Premium


Premium


Premium


Premium


Premium


Premium