- Home >
- Stock Photos >
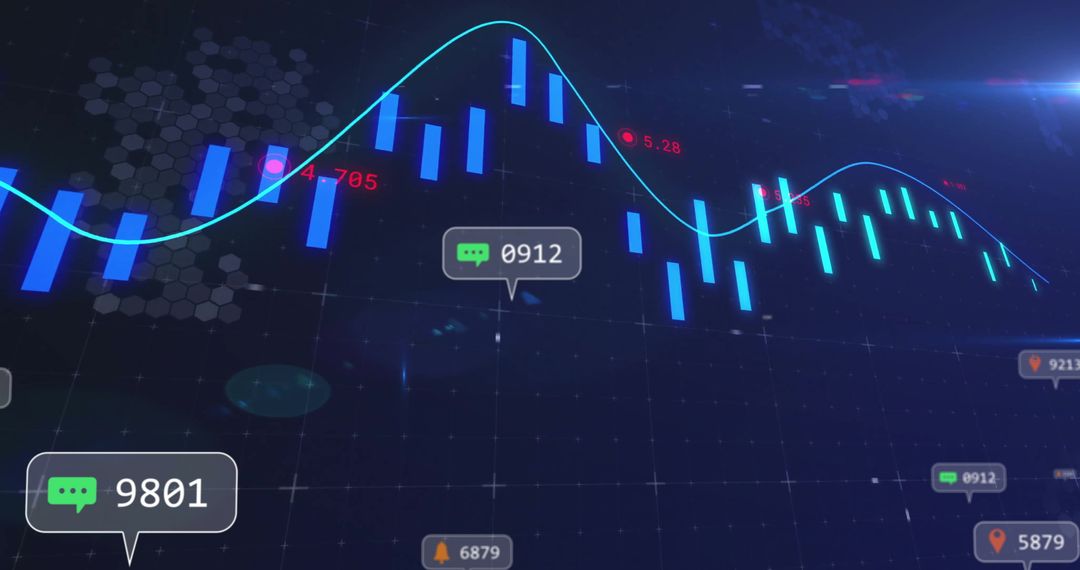
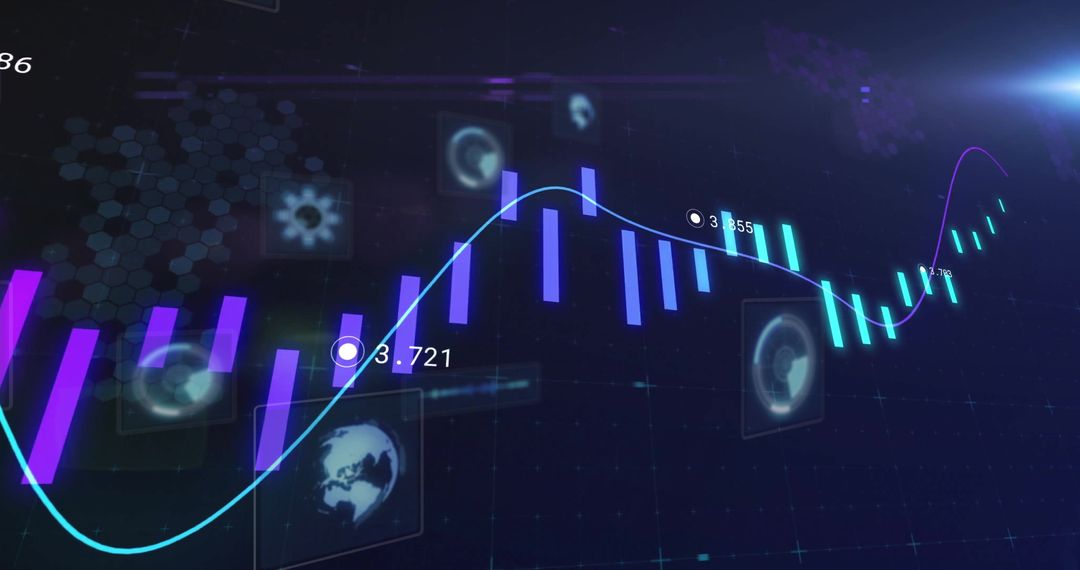
- Innovative Stock Market Data with Candlestick Chart and Trendline
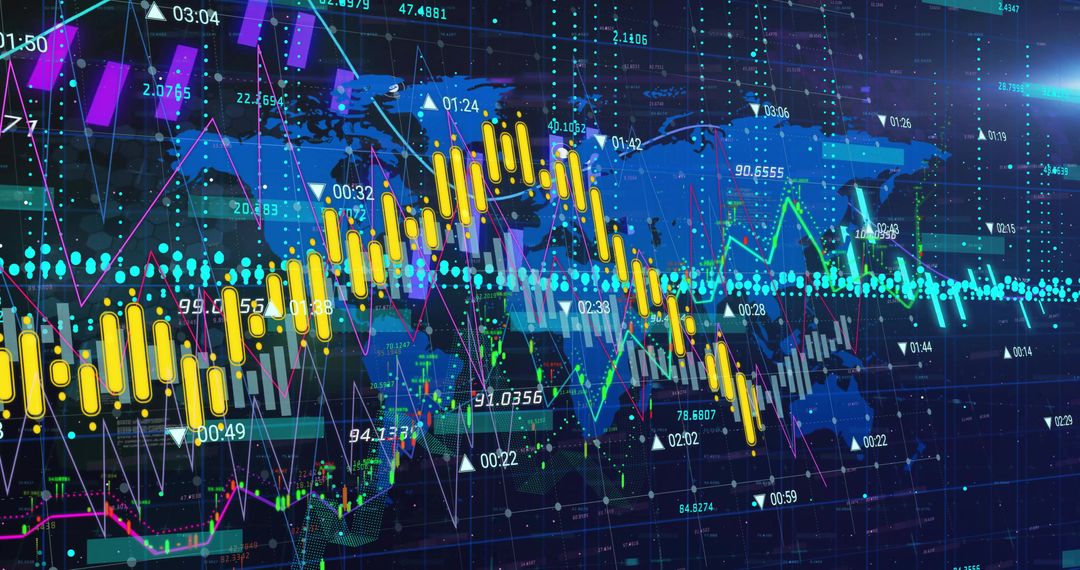
Innovative Stock Market Data with Candlestick Chart and Trendline Image

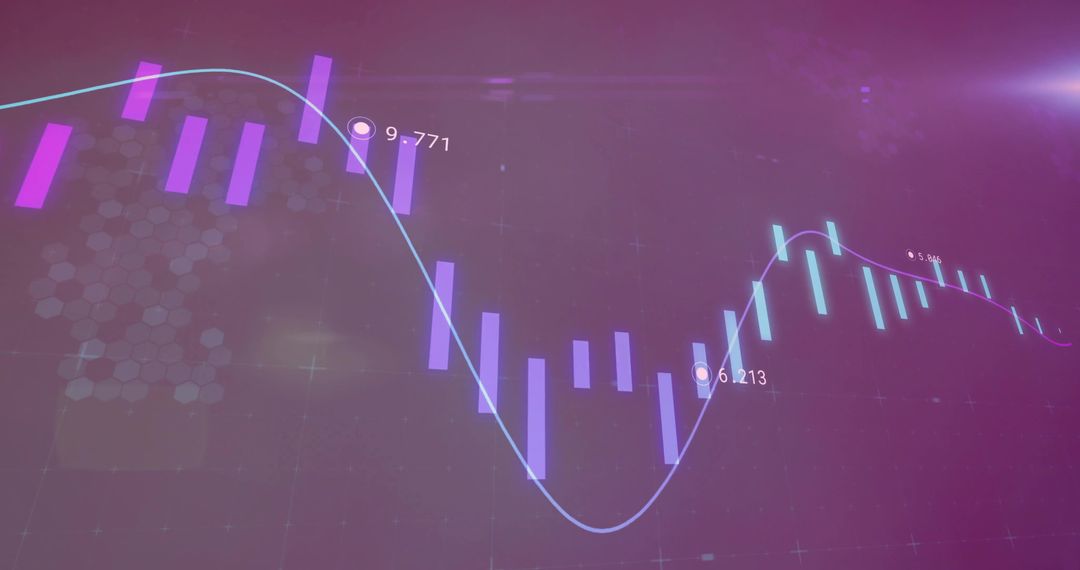
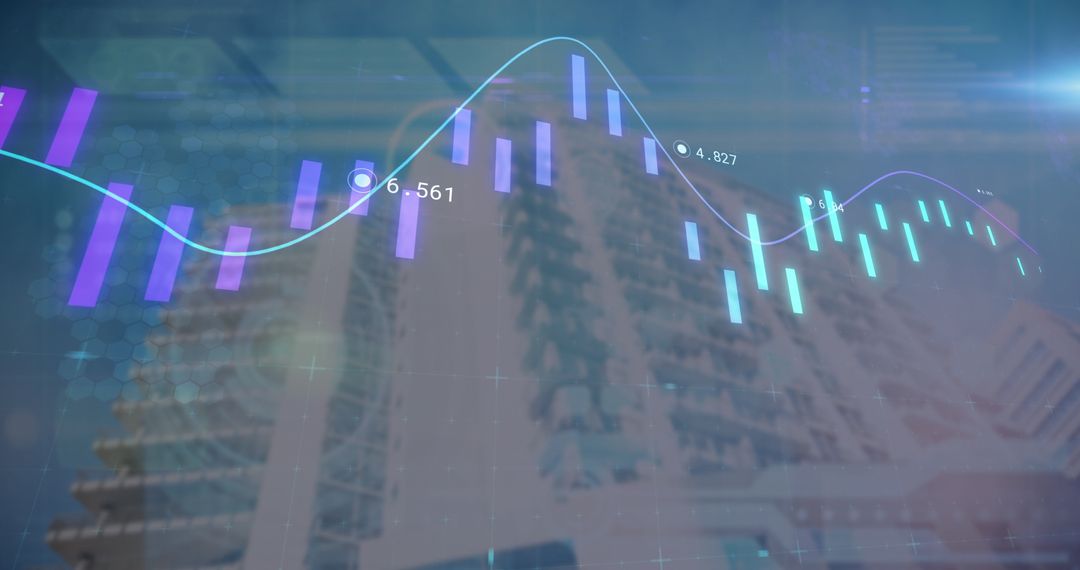
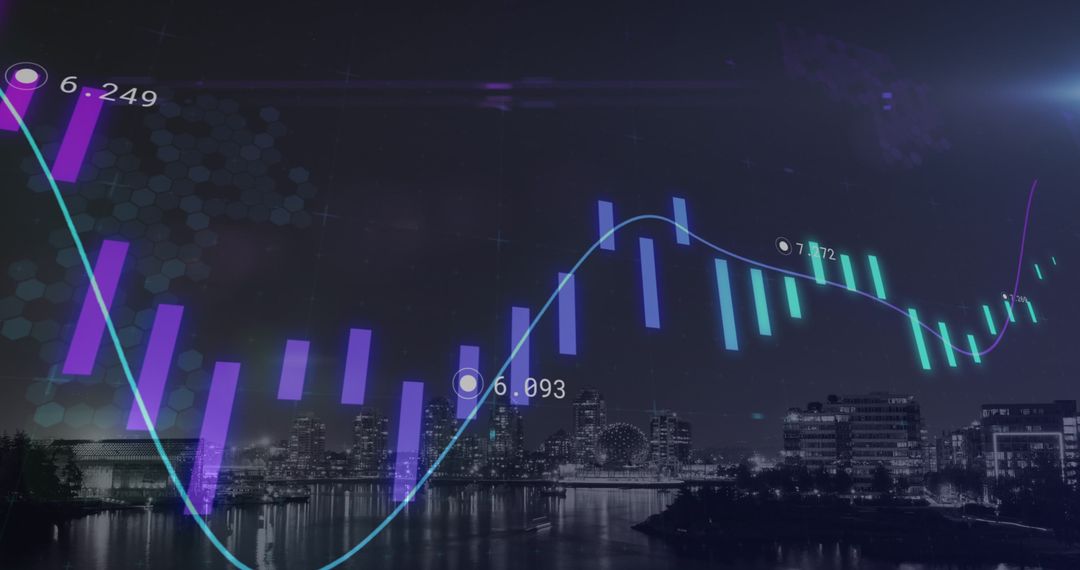
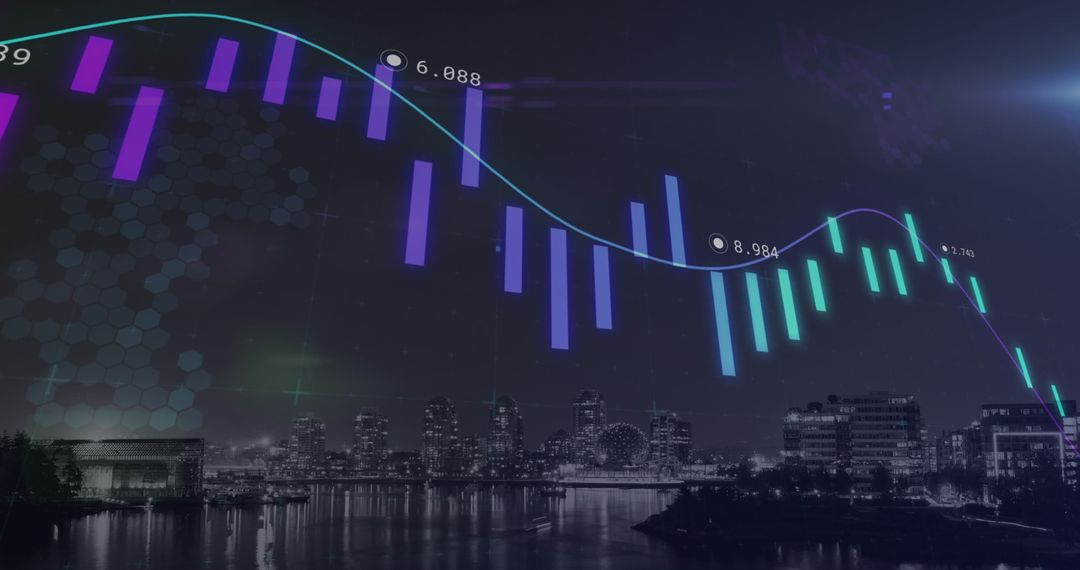
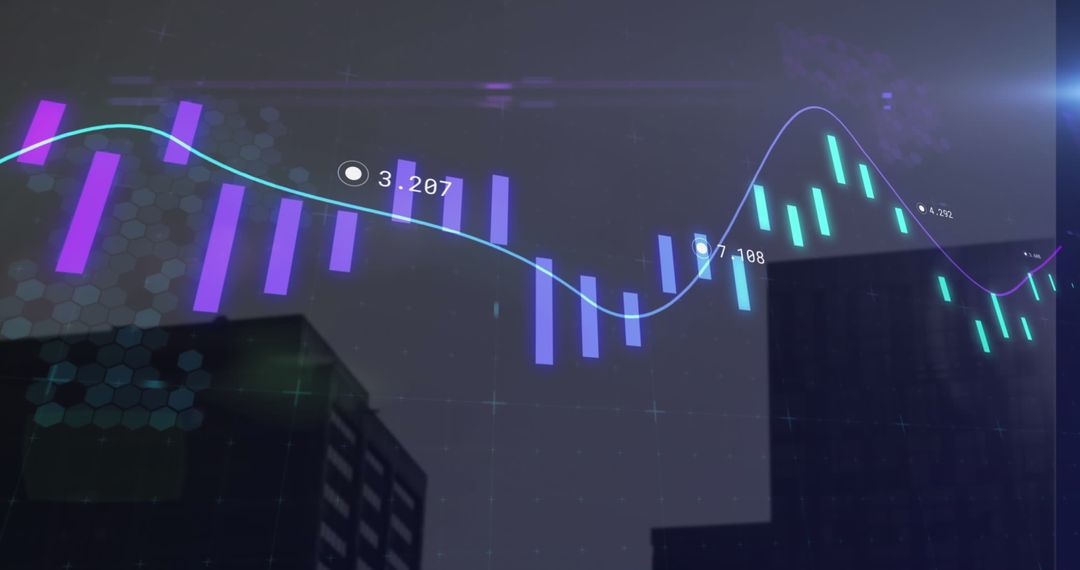
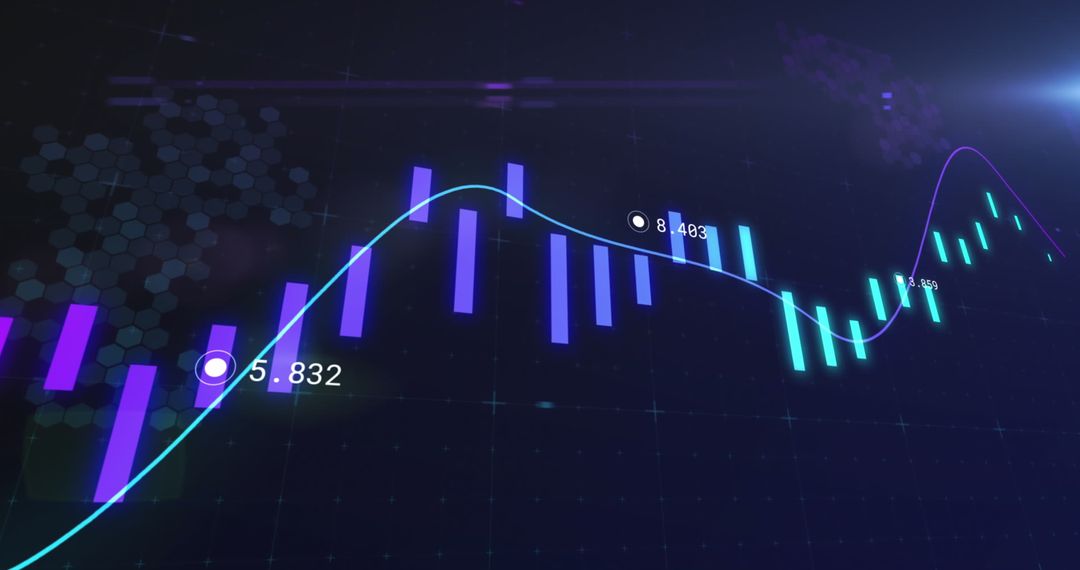
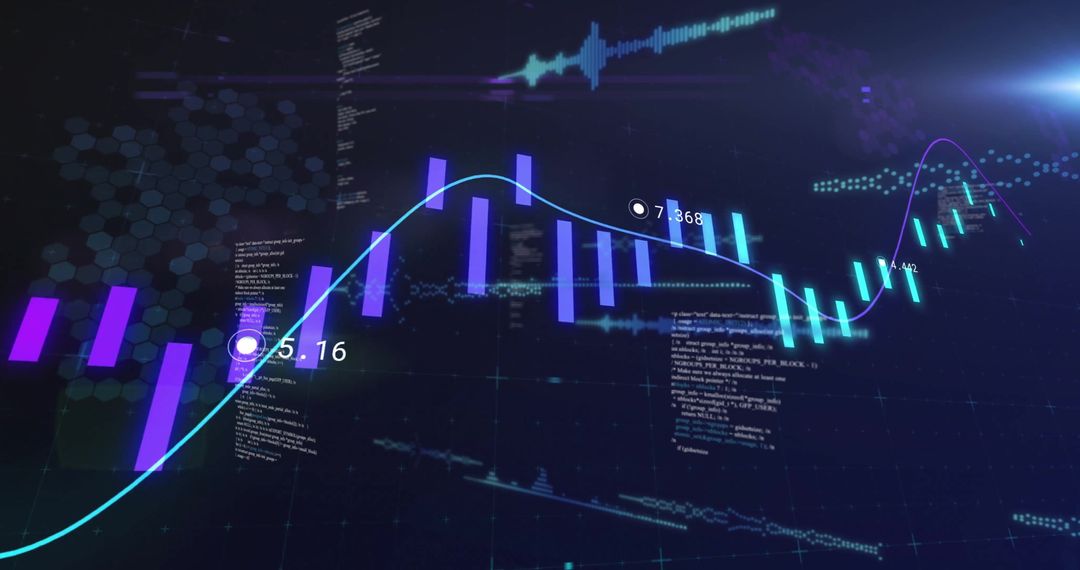
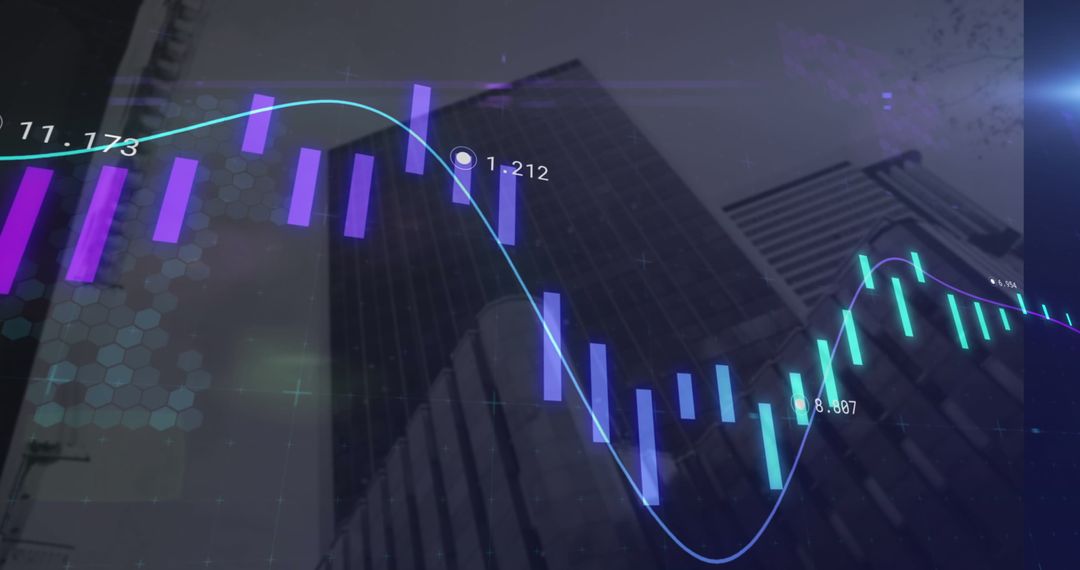
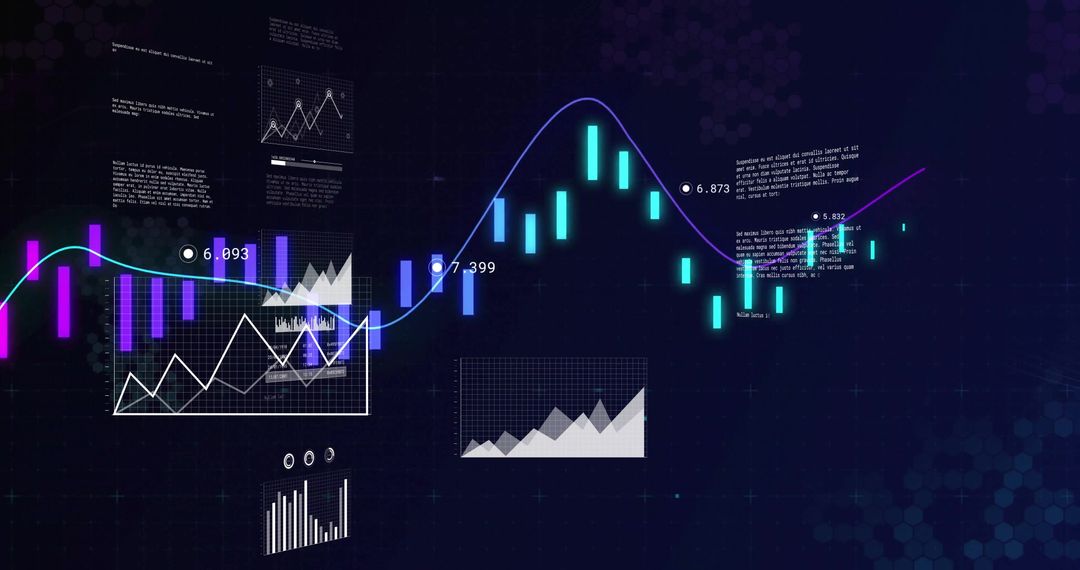
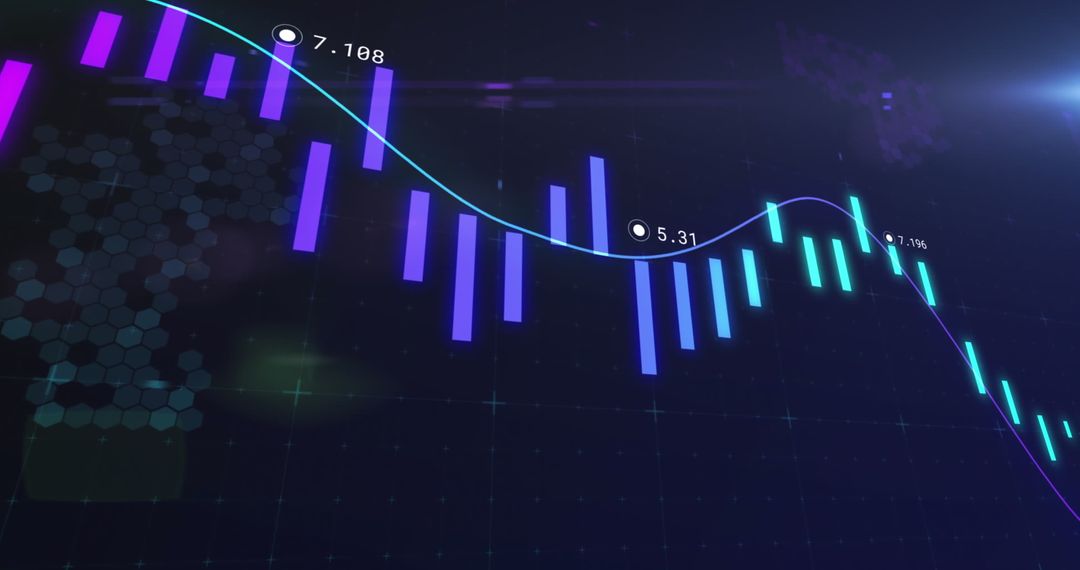
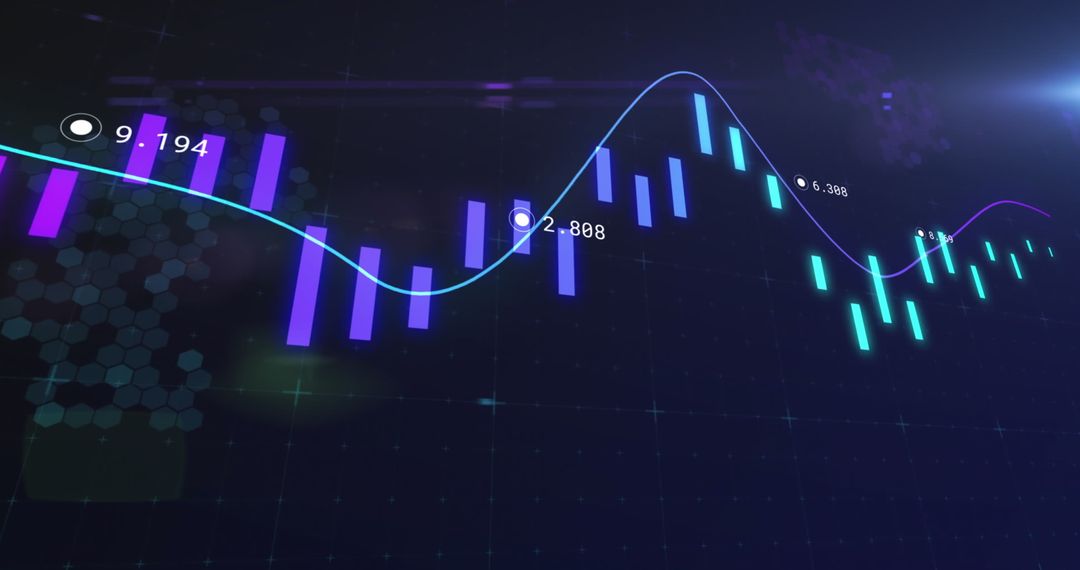
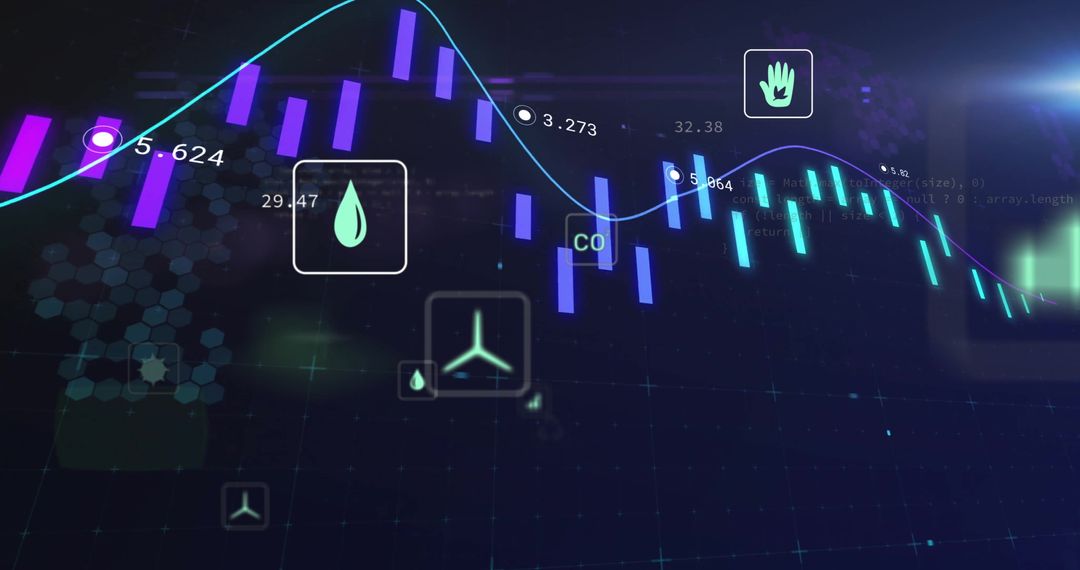
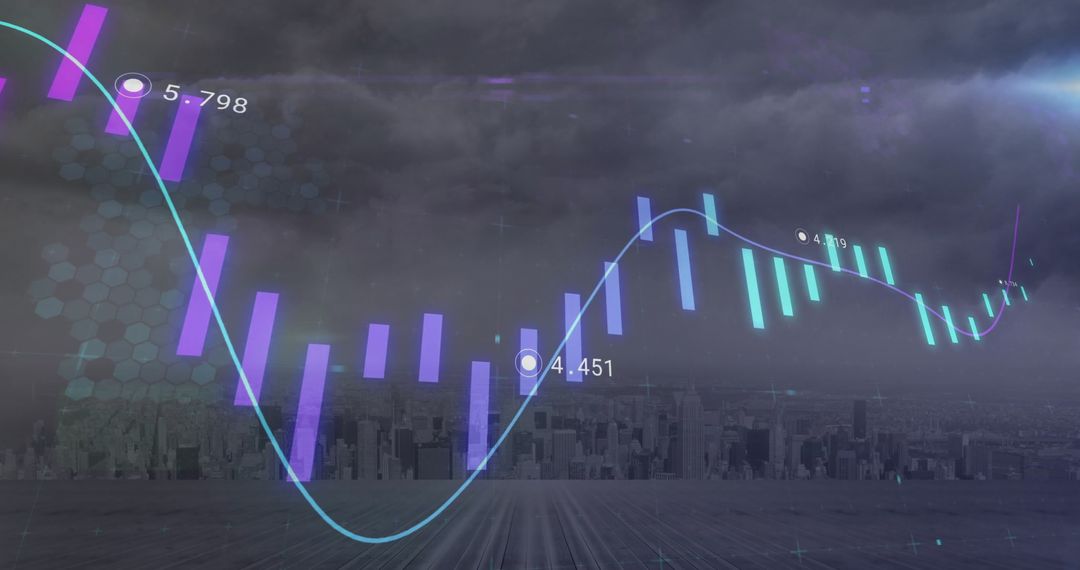
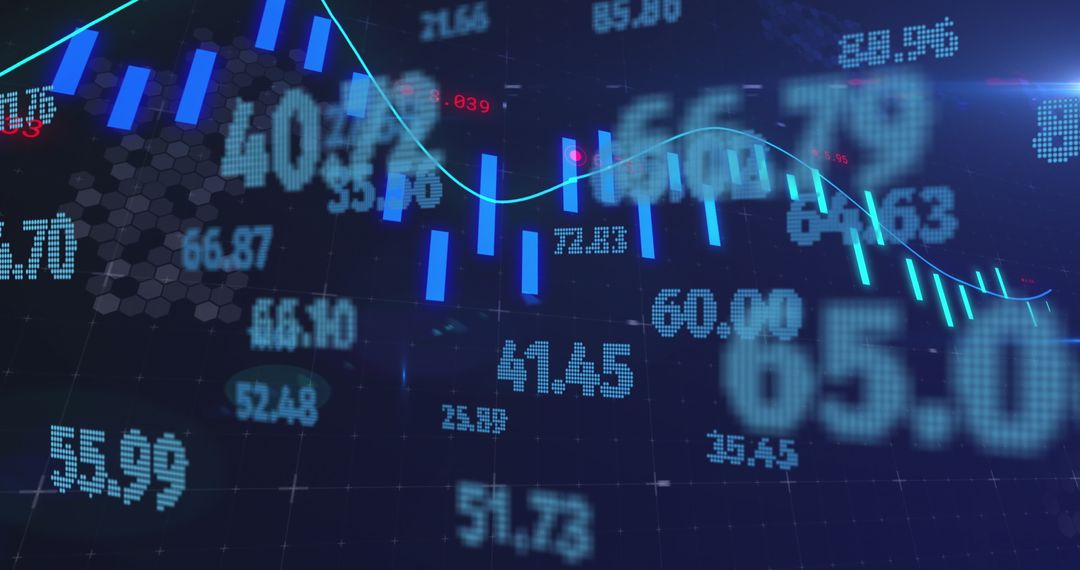
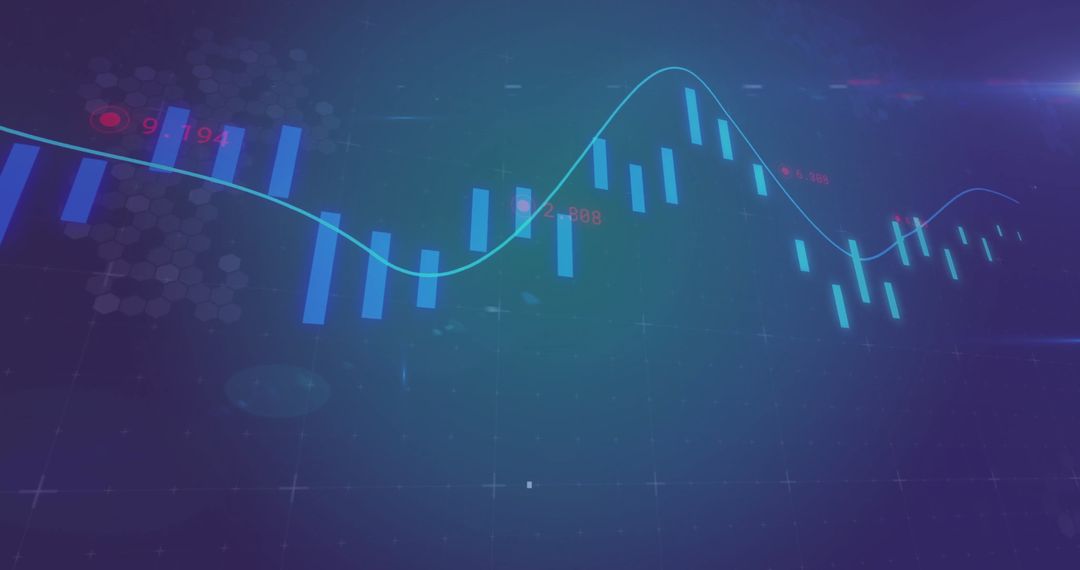
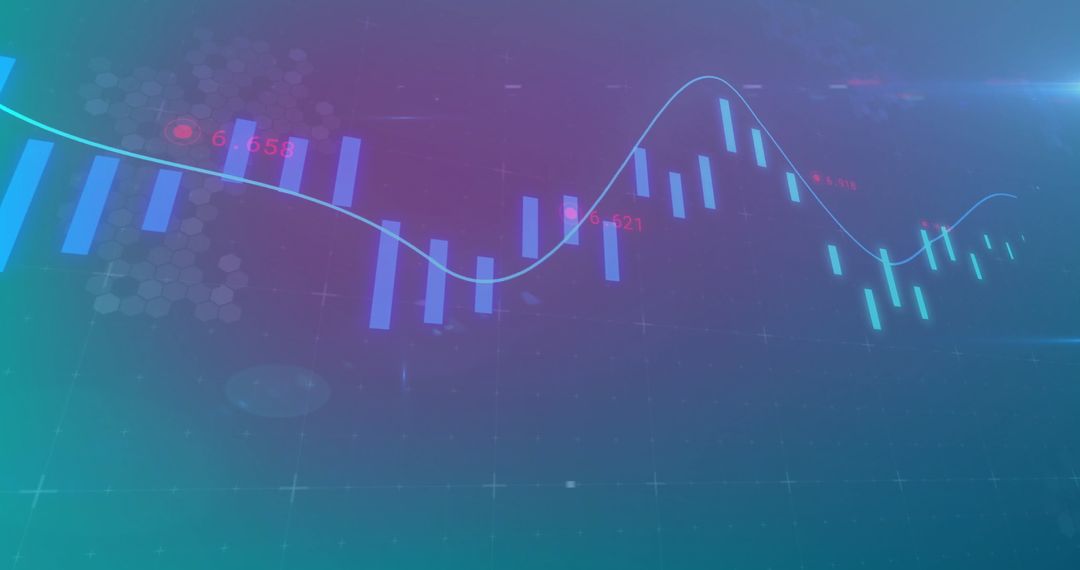
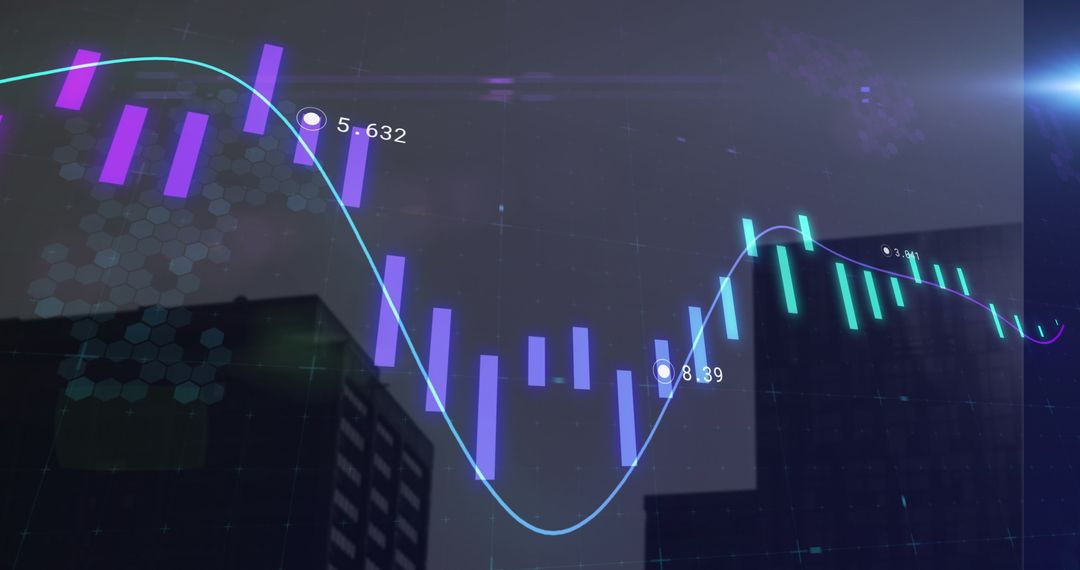
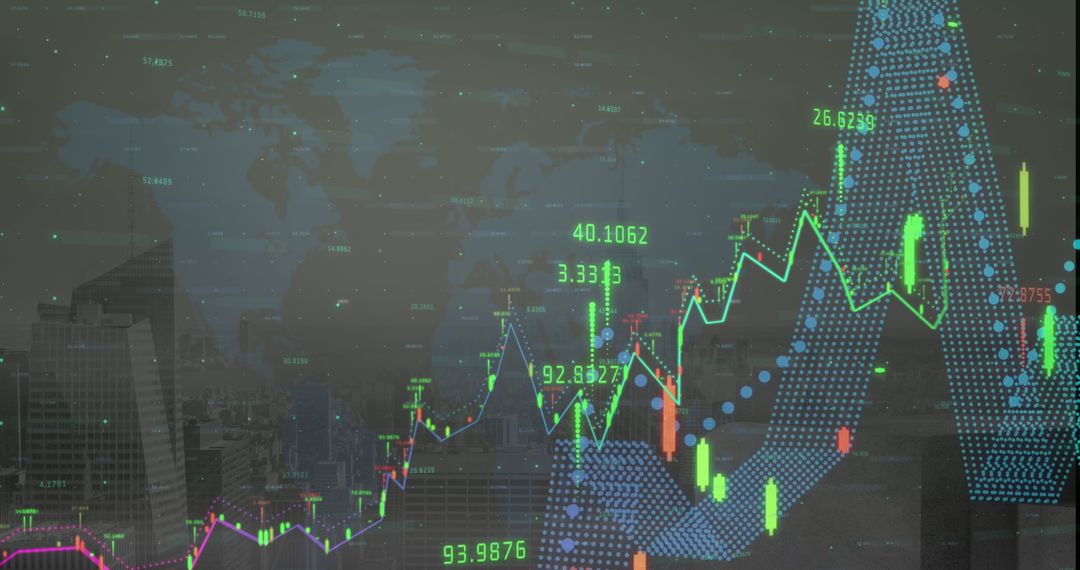
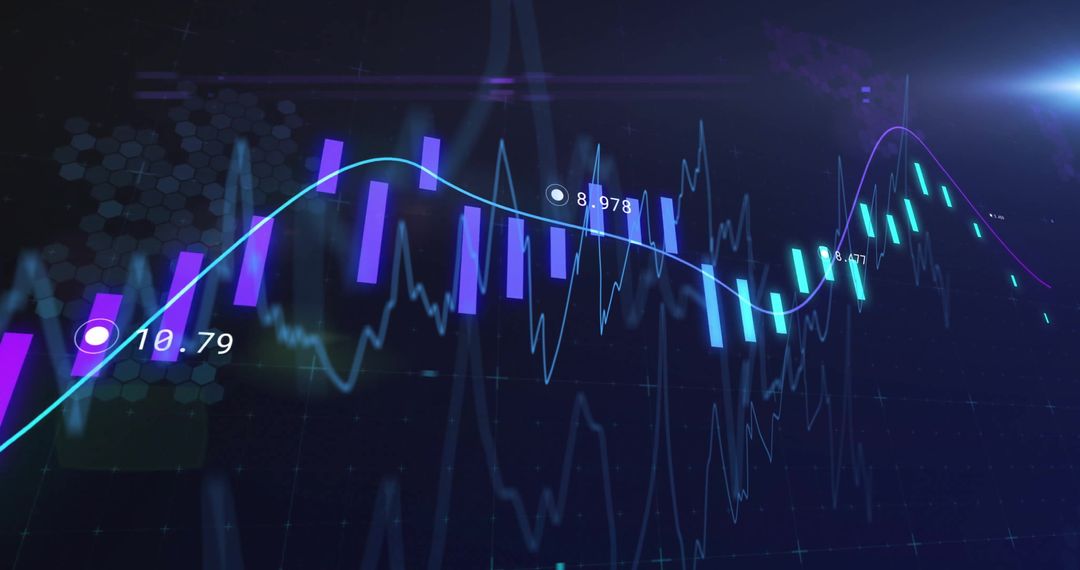
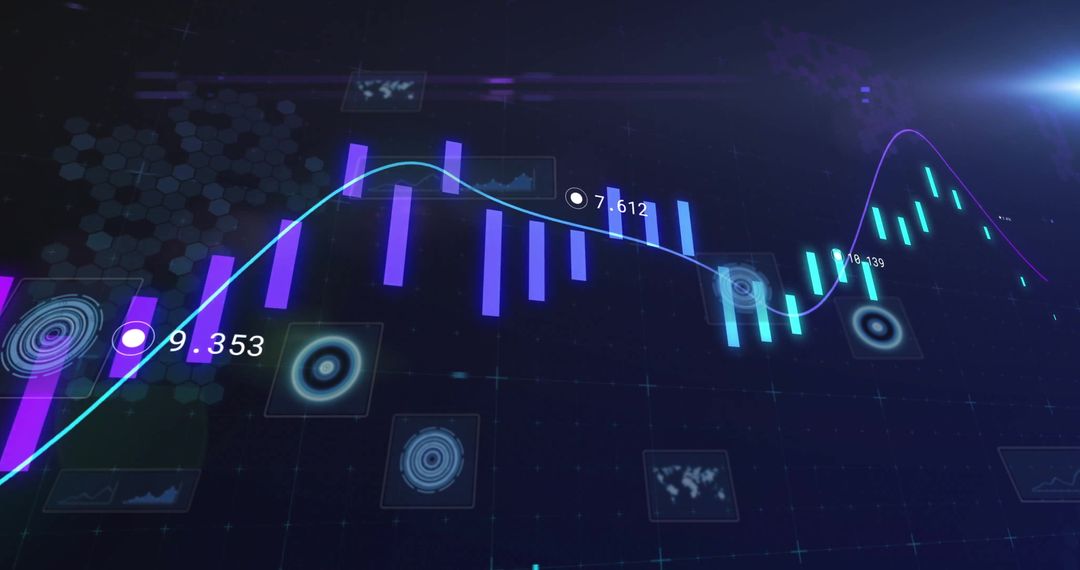
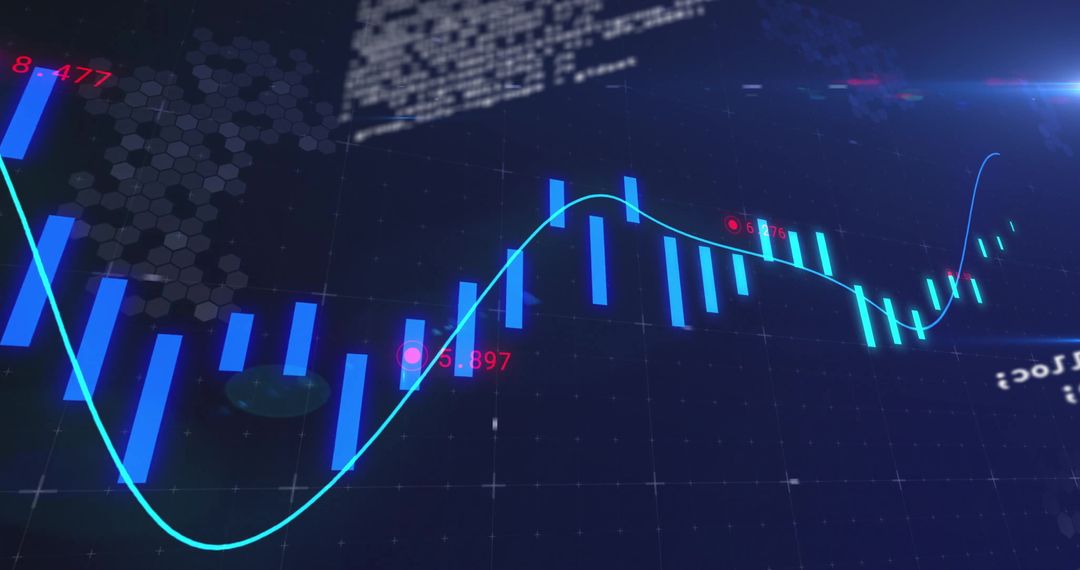
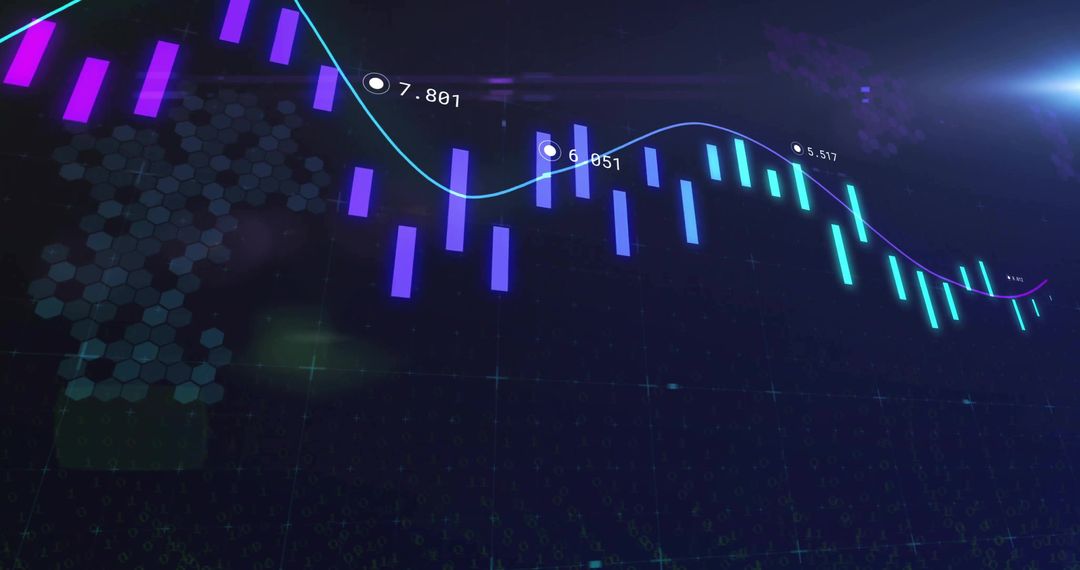
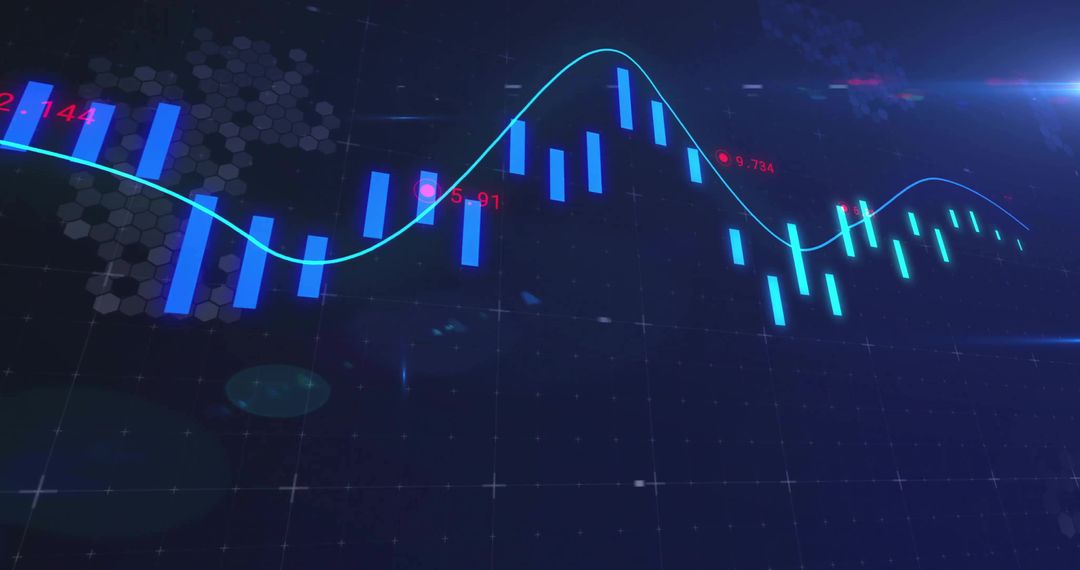
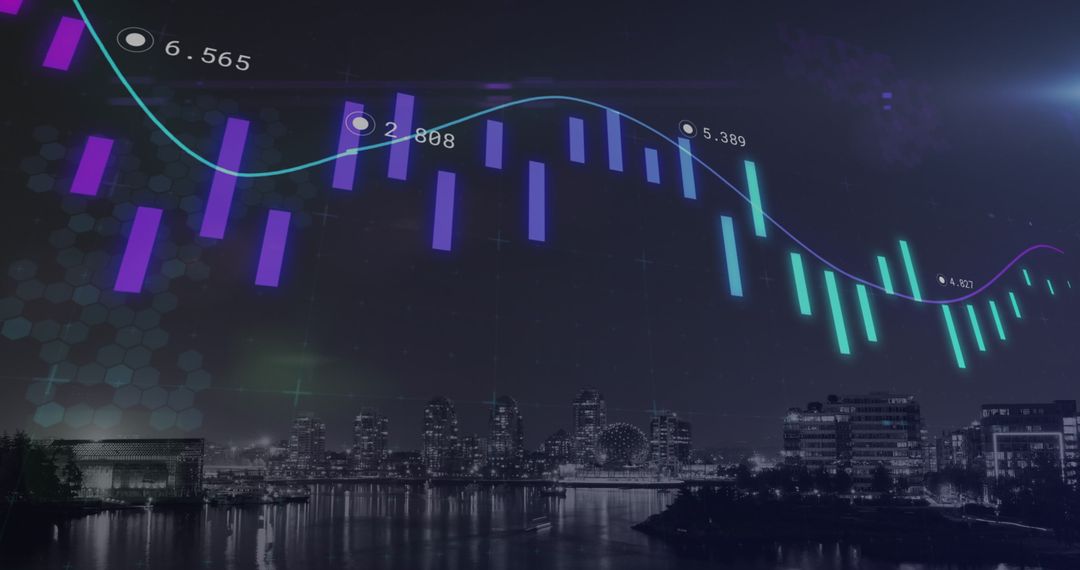
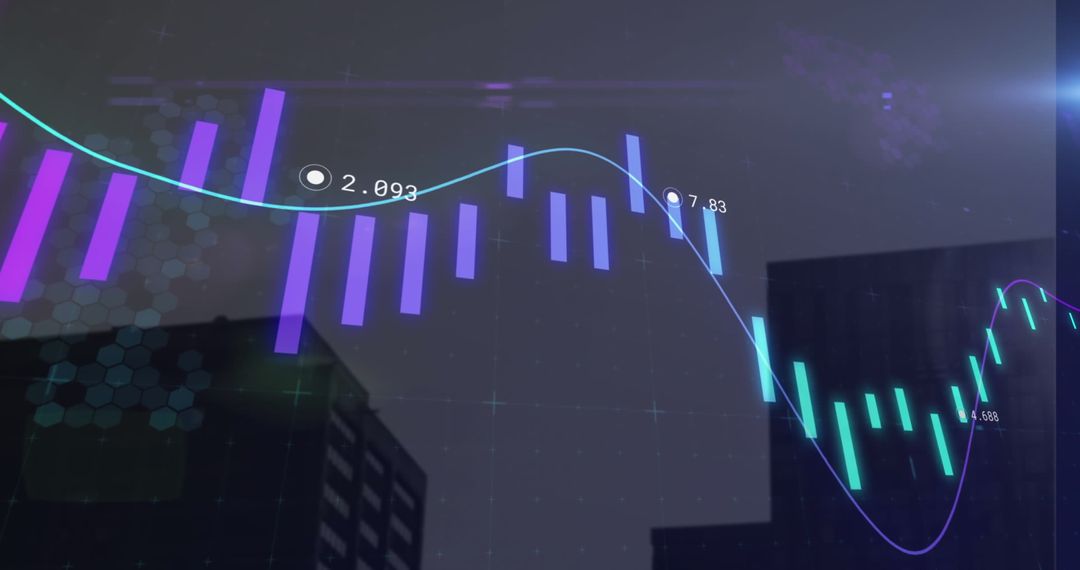
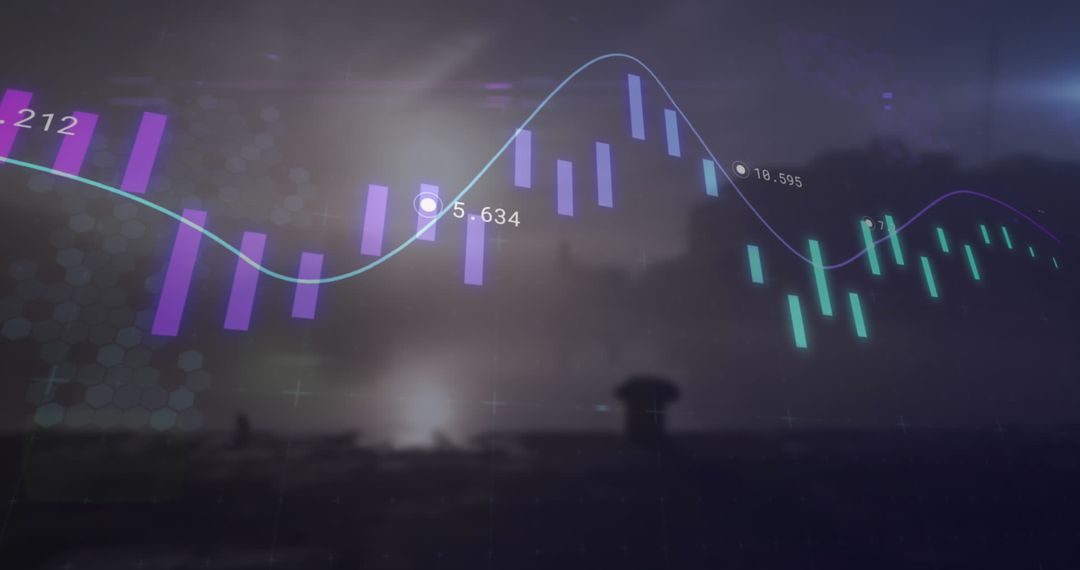
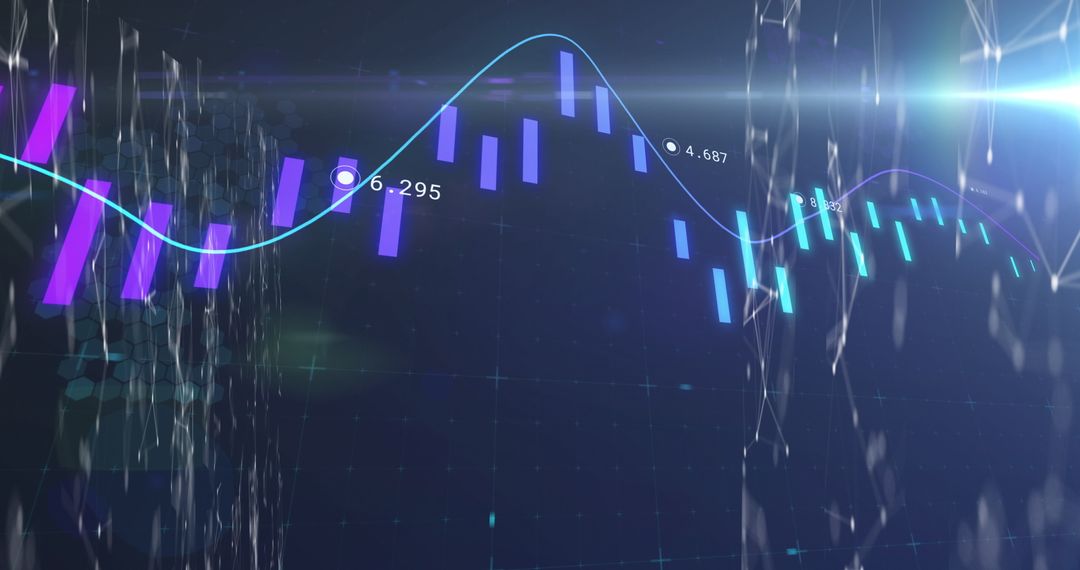
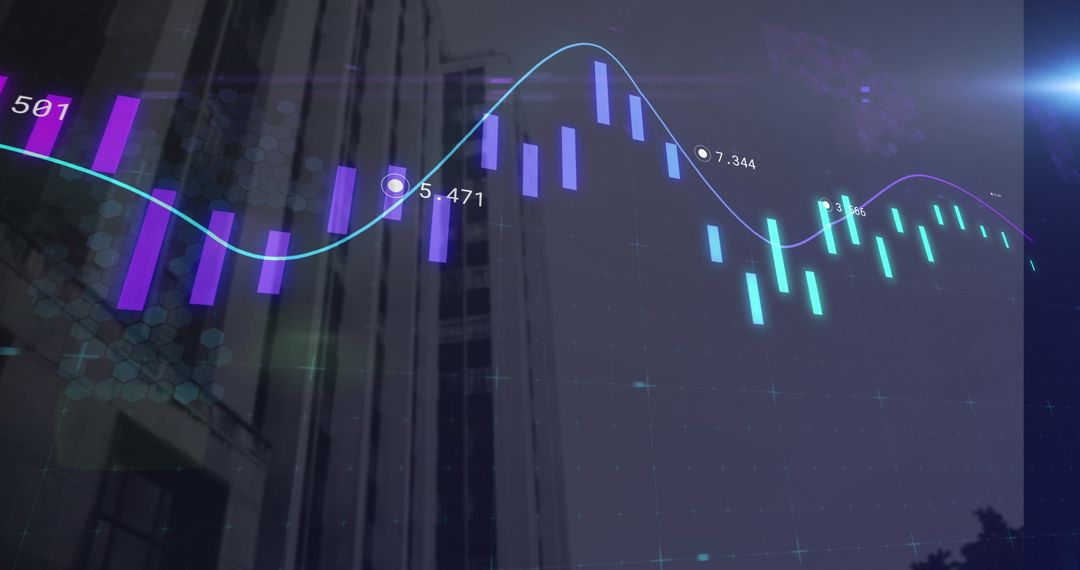
Digital visualization of stock market data showing candlestick bars juxtaposed with analytical trendline on a hex grid background provides an innovative look for technology and finance presentations. Ideal for finance reports, tech infographics or educational materials demonstrating data analytics and investment strategies.
Powered by 


0
downloads
downloads
Tags:
More
Credit Photo
If you would like to credit the Photo, here are some ways you can do so
Text Link
photo Link
<span class="text-link">
<span>
<a target="_blank" href=https://pikwizard.com/photo/innovative-stock-market-data-with-candlestick-chart-and-trendline/9dcd11d4029d83d7e8f492cd57fdbd18/>PikWizard</a>
</span>
</span>
<span class="image-link">
<span
style="margin: 0 0 20px 0; display: inline-block; vertical-align: middle; width: 100%;"
>
<a
target="_blank"
href="https://pikwizard.com/photo/innovative-stock-market-data-with-candlestick-chart-and-trendline/9dcd11d4029d83d7e8f492cd57fdbd18/"
style="text-decoration: none; font-size: 10px; margin: 0;"
>
<img src="https://pikwizard.com/pw/medium/9dcd11d4029d83d7e8f492cd57fdbd18.jpg" style="margin: 0; width: 100%;" alt="" />
<p style="font-size: 12px; margin: 0;">PikWizard</p>
</a>
</span>
</span>
Free (free of charge)
Free for personal and commercial use.
Author: People Creations
Similar Free Stock Images

Premium


Premium


Premium


Premium


Premium

Premium


Premium


Premium


Premium


Premium


Premium


Premium


Premium


Premium


Premium


Premium


Premium


Premium


Premium


Premium


Premium


Premium


Premium


Premium