- Home >
- Stock Photos >
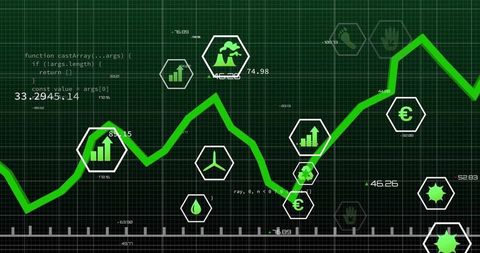
- Innovative Technology Dashboard Displaying Analytics and Trends
Innovative Technology Dashboard Displaying Analytics and Trends Image

Illustrates modern digital dashboard essential for businesses engaged in technology and data innovation. Useful for presentations, articles discussing advancements in analytics and sustainability. Can serve educational purposes as a visualization of corporate metrics.

downloads
Tags:
More
Credit Photo
If you would like to credit the Photo, here are some ways you can do so
Text Link
photo Link
<span class="text-link">
<span>
<a target="_blank" href=https://pikwizard.com/photo/innovative-technology-dashboard-displaying-analytics-and-trends/4c3989948a1fb0a4f433dfc0fb09ea3d/>PikWizard</a>
</span>
</span>
<span class="image-link">
<span
style="margin: 0 0 20px 0; display: inline-block; vertical-align: middle; width: 100%;"
>
<a
target="_blank"
href="https://pikwizard.com/photo/innovative-technology-dashboard-displaying-analytics-and-trends/4c3989948a1fb0a4f433dfc0fb09ea3d/"
style="text-decoration: none; font-size: 10px; margin: 0;"
>
<img src="https://pikwizard.com/pw/medium/4c3989948a1fb0a4f433dfc0fb09ea3d.jpg" style="margin: 0; width: 100%;" alt="" />
<p style="font-size: 12px; margin: 0;">PikWizard</p>
</a>
</span>
</span>
Free (free of charge)
Free for personal and commercial use.
Author: Authentic Images