- Home >
- Stock Photos >
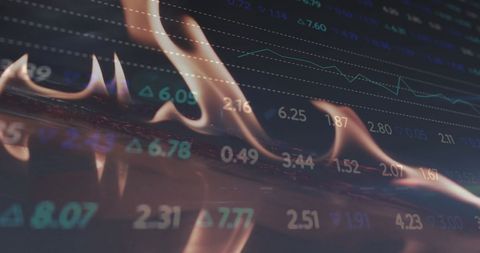
- Innovative Technology Stocks with Risk Icon
Innovative Technology Stocks with Risk Icon Image

Graph depicting financial data against a background of digital flames, symbolizing volatility and risk in technology investments. Useful for illustrating concepts of market uncertainty, financial analysis, or the rapid changes in the tech sector.
Powered by 


downloads
Tags:
More
Credit Photo
If you would like to credit the Photo, here are some ways you can do so
Text Link
photo Link
<span class="text-link">
<span>
<a target="_blank" href=https://pikwizard.com/photo/innovative-technology-stocks-with-risk-icon/50d92a0a8a47b87dbc205a9121869de1/>PikWizard</a>
</span>
</span>
<span class="image-link">
<span
style="margin: 0 0 20px 0; display: inline-block; vertical-align: middle; width: 100%;"
>
<a
target="_blank"
href="https://pikwizard.com/photo/innovative-technology-stocks-with-risk-icon/50d92a0a8a47b87dbc205a9121869de1/"
style="text-decoration: none; font-size: 10px; margin: 0;"
>
<img src="https://pikwizard.com/pw/medium/50d92a0a8a47b87dbc205a9121869de1.jpg" style="margin: 0; width: 100%;" alt="" />
<p style="font-size: 12px; margin: 0;">PikWizard</p>
</a>
</span>
</span>
Free (free of charge)
Free for personal and commercial use.
Author: Creative Art
Similar Free Stock Images
Loading...

Premium


Premium


Premium


Premium


Premium

Premium


Premium


Premium


Premium


Premium


Premium


Premium


Premium


Premium


Premium


Premium


Premium

Premium


Premium


Premium


Premium

Premium


Premium


Premium


Premium