
- Home >
- Stock Photos >
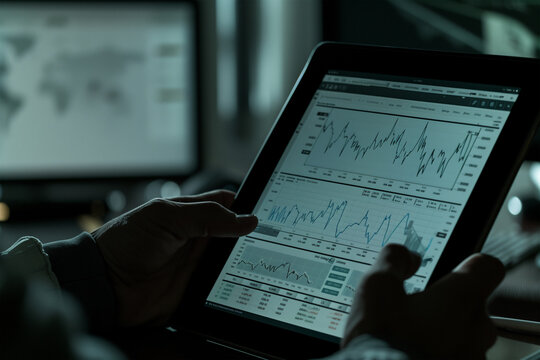
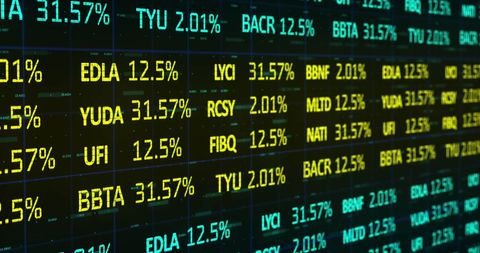
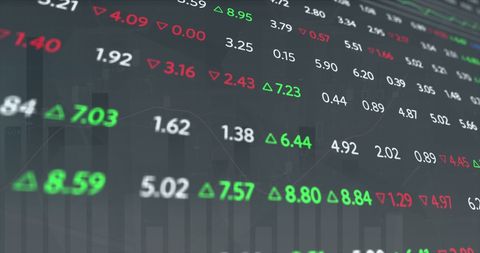
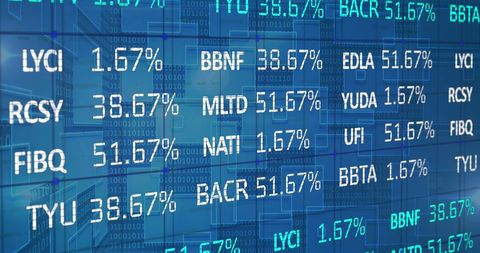
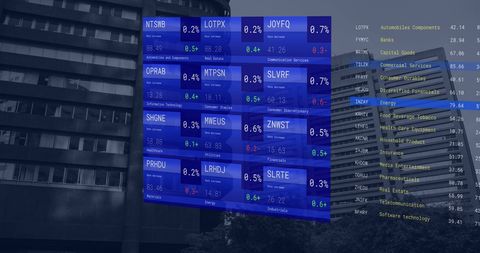
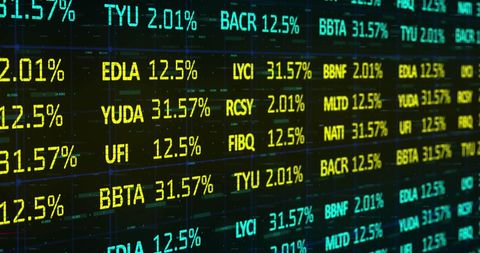
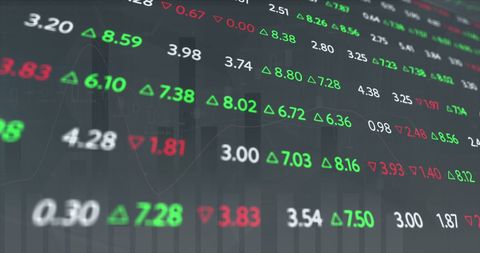
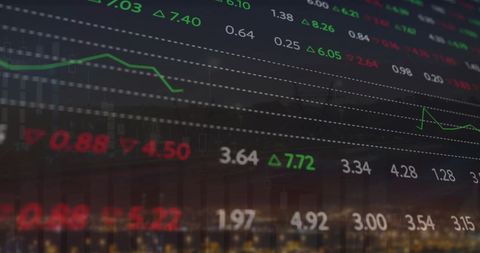
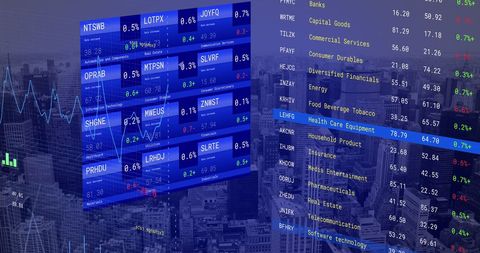
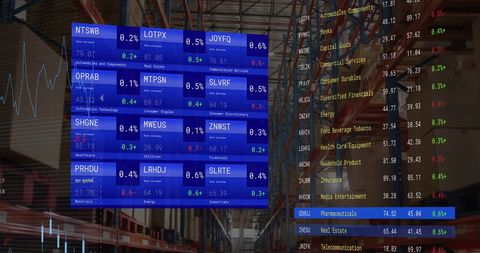
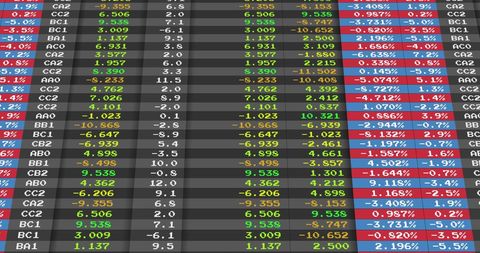
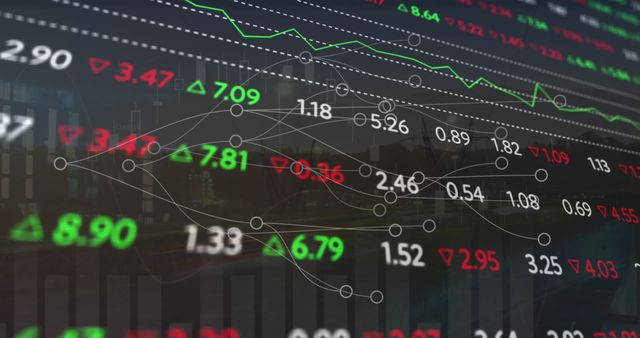
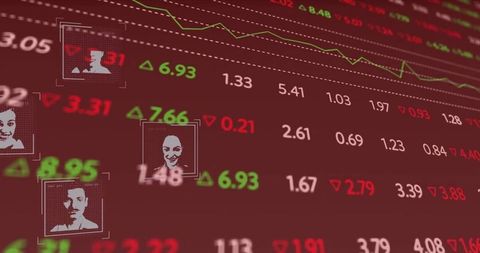
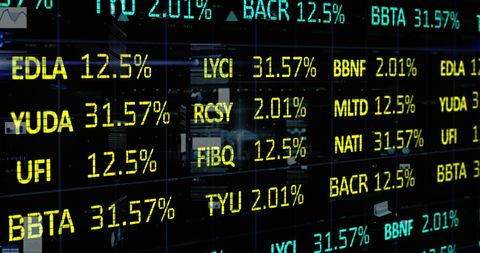
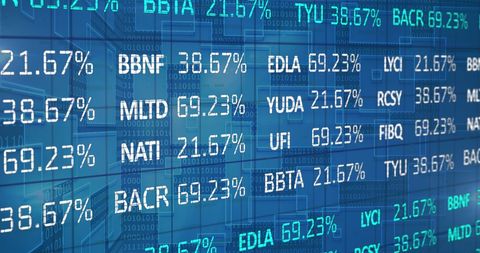
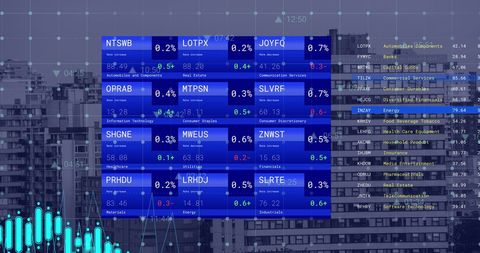
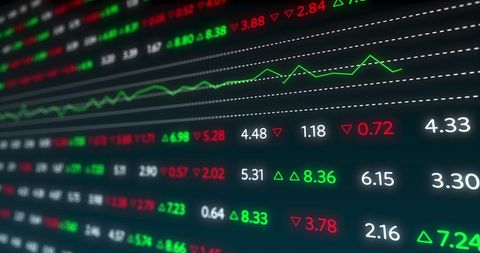
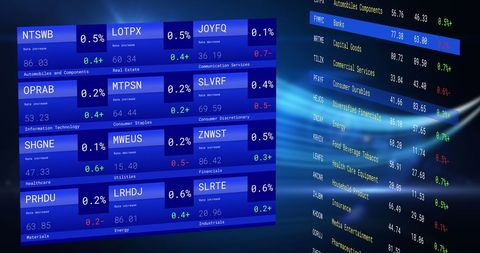
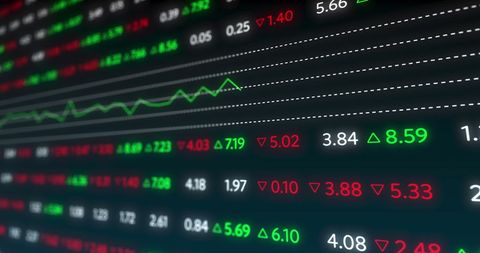
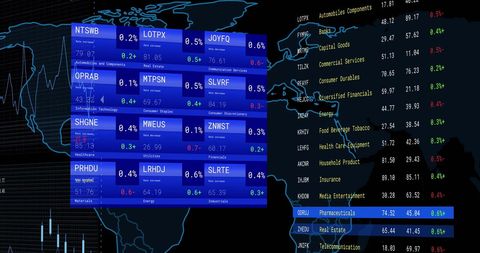
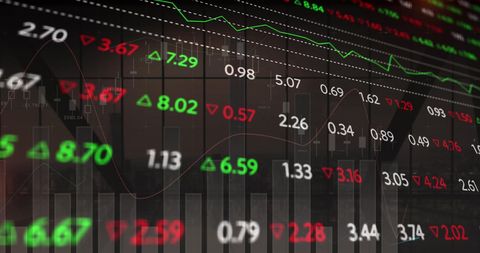
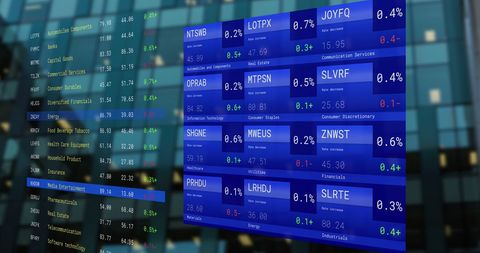
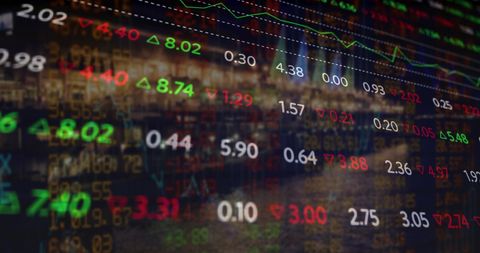
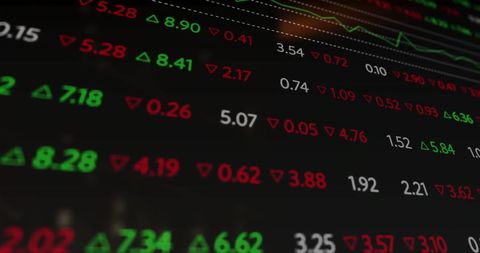
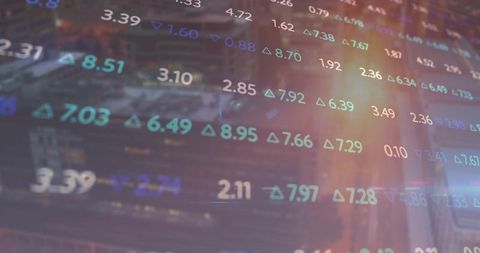
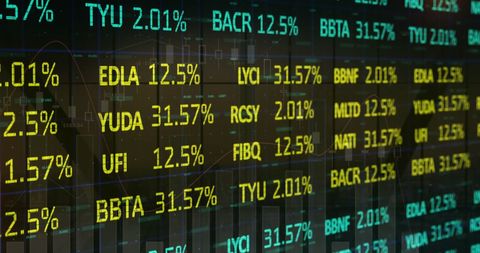
- Integrated Financial Data Analytics on Multiple Monitors
Integrated Financial Data Analytics on Multiple Monitors Image
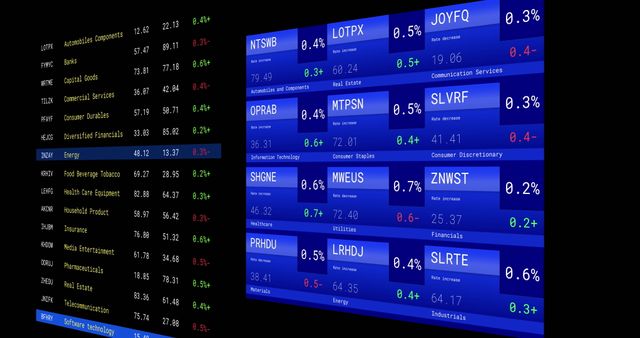
Visuals of financial data streams are ideal for presentations related to stock markets, financial analysis, or economic trends. Useful for illustrating concepts in fintech, investment strategies, or data pattern identification in global markets. Effective for educational material focusing on understanding financial data tracking and technological innovation in finance.
Powered by 


downloads
Tags:
More
Credit Photo
If you would like to credit the Photo, here are some ways you can do so
Text Link
photo Link
<span class="text-link">
<span>
<a target="_blank" href=https://pikwizard.com/photo/integrated-financial-data-analytics-on-multiple-monitors/55101a4129a4385b51af5ca5849604fa/>PikWizard</a>
</span>
</span>
<span class="image-link">
<span
style="margin: 0 0 20px 0; display: inline-block; vertical-align: middle; width: 100%;"
>
<a
target="_blank"
href="https://pikwizard.com/photo/integrated-financial-data-analytics-on-multiple-monitors/55101a4129a4385b51af5ca5849604fa/"
style="text-decoration: none; font-size: 10px; margin: 0;"
>
<img src="https://pikwizard.com/pw/medium/55101a4129a4385b51af5ca5849604fa.jpg" style="margin: 0; width: 100%;" alt="" />
<p style="font-size: 12px; margin: 0;">PikWizard</p>
</a>
</span>
</span>
Free (free of charge)
Free for personal and commercial use.
Author: Creative Art
Similar Free Stock Images
Premium

Premium

Premium

Premium

AI
Premium


Premium

Premium


Premium


Premium

Premium


Premium

Premium

Premium

Premium

Premium

Premium

Premium


Premium

Premium


Premium


Premium


Premium


Premium


Premium


Premium

Explore More Free Stock Images