
- Home >
- Stock Photos >
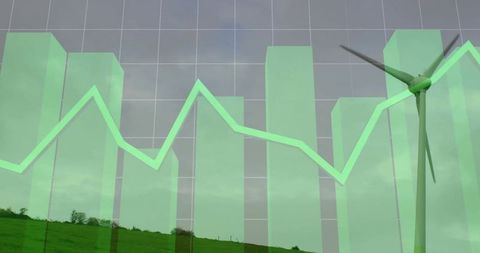
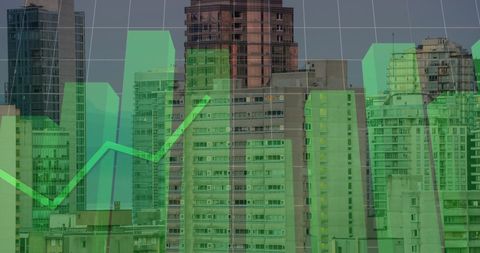
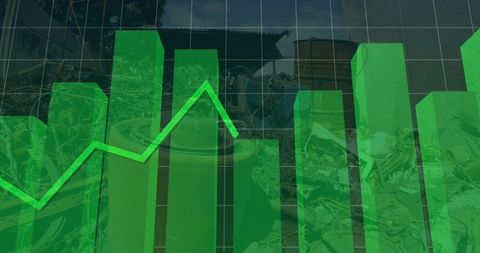
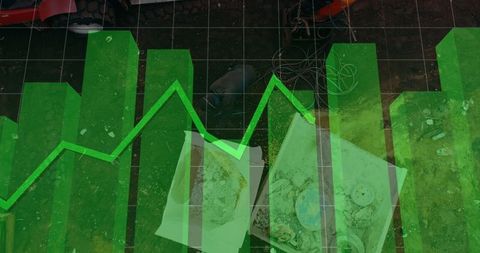
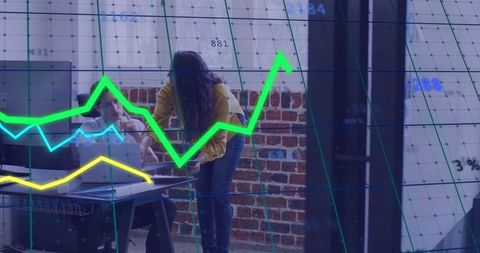
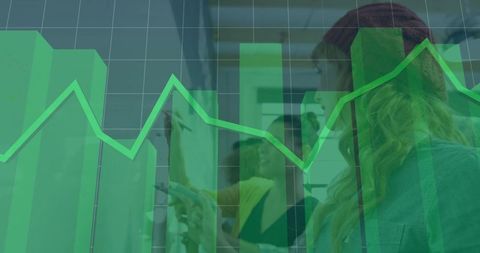
- Integrating Lifestyle with Data Analytics Conceptual Visualization
Integrating Lifestyle with Data Analytics Conceptual Visualization Image
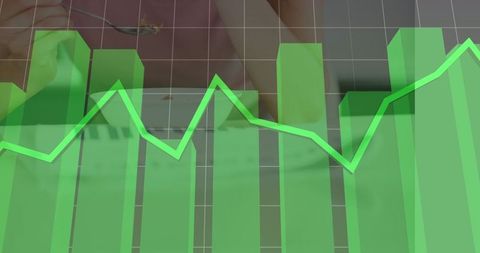
Creative fusion of everyday life and data visualization combining breakfast setting with analytical graphs. Ideal for illustrating the integration of personal lifestyles with data analytics. Useful for business presentations, technology blogs, and articles on the impact of analytics in daily life meetings.
Powered by  - Get 15% off with code: PIKWIZARD15


downloads
Tags:
More
Credit Photo
If you would like to credit the Photo, here are some ways you can do so
Text Link
photo Link
<span class="text-link">
<span>
<a target="_blank" href=https://pikwizard.com/photo/integrating-lifestyle-with-data-analytics-conceptual-visualization/3859dca6083e4987b673c04ba406cc5b/>PikWizard</a>
</span>
</span>
<span class="image-link">
<span
style="margin: 0 0 20px 0; display: inline-block; vertical-align: middle; width: 100%;"
>
<a
target="_blank"
href="https://pikwizard.com/photo/integrating-lifestyle-with-data-analytics-conceptual-visualization/3859dca6083e4987b673c04ba406cc5b/"
style="text-decoration: none; font-size: 10px; margin: 0;"
>
<img src="https://pikwizard.com/pw/medium/3859dca6083e4987b673c04ba406cc5b.jpg" style="margin: 0; width: 100%;" alt="" />
<p style="font-size: 12px; margin: 0;">PikWizard</p>
</a>
</span>
</span>
Free (free of charge)
Free for personal and commercial use.
Author: Authentic Images
Similar Free Stock Images
Premium


Premium

Premium


Premium

Premium

Premium


Premium


Explore More Free Stock Images