
- Home >
- Stock Photos >
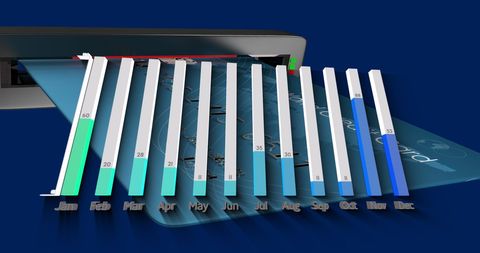
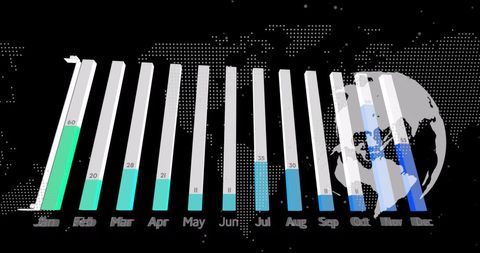
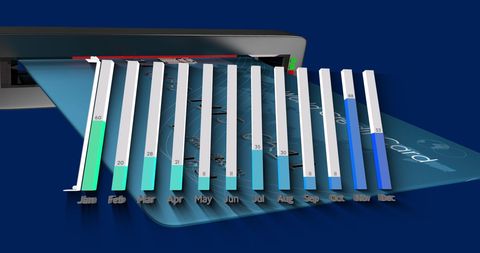
- Interactive 3D Business Data Chart with Connectivity Network
Interactive 3D Business Data Chart with Connectivity Network Image

A futuristic 3D chart illustrates data within a digital network setting, suggesting complex analysis. The hand-holding digital card ties business concepts to human touch. Use in financial analysis reports, business strategy presentations, or technology innovation content.
Powered by 


downloads
Tags:
More
Credit Photo
If you would like to credit the Photo, here are some ways you can do so
Text Link
photo Link
<span class="text-link">
<span>
<a target="_blank" href=https://pikwizard.com/photo/interactive-3d-business-data-chart-with-connectivity-network/47790129aa83d8ebb611ce48d5d12b77/>PikWizard</a>
</span>
</span>
<span class="image-link">
<span
style="margin: 0 0 20px 0; display: inline-block; vertical-align: middle; width: 100%;"
>
<a
target="_blank"
href="https://pikwizard.com/photo/interactive-3d-business-data-chart-with-connectivity-network/47790129aa83d8ebb611ce48d5d12b77/"
style="text-decoration: none; font-size: 10px; margin: 0;"
>
<img src="https://pikwizard.com/pw/medium/47790129aa83d8ebb611ce48d5d12b77.jpg" style="margin: 0; width: 100%;" alt="" />
<p style="font-size: 12px; margin: 0;">PikWizard</p>
</a>
</span>
</span>
Free (free of charge)
Free for personal and commercial use.
Author: Awesome Content
Similar Free Stock Images

Premium


Premium


Premium


Premium


Premium


Premium


Premium

Premium


Premium


Premium


Premium


Premium

Premium


Premium


Premium


Premium

Premium

Premium


Premium


Premium


Premium


Premium


Premium


Premium

Premium


Explore More Free Stock Images