
- Home >
- Stock Photos >
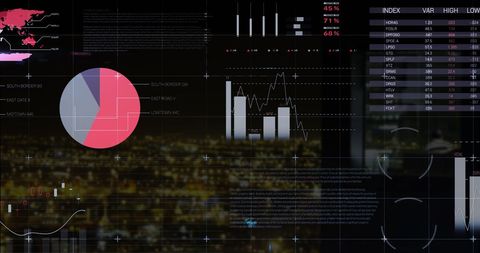
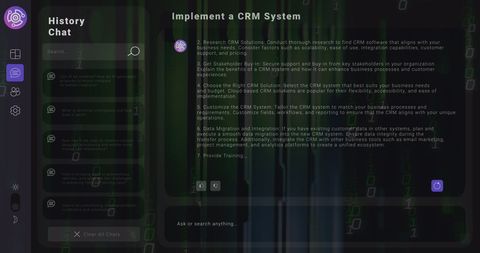
- Interactive Analytics UI with Charts, Graphs and Notifications
Interactive Analytics UI with Charts, Graphs and Notifications Image
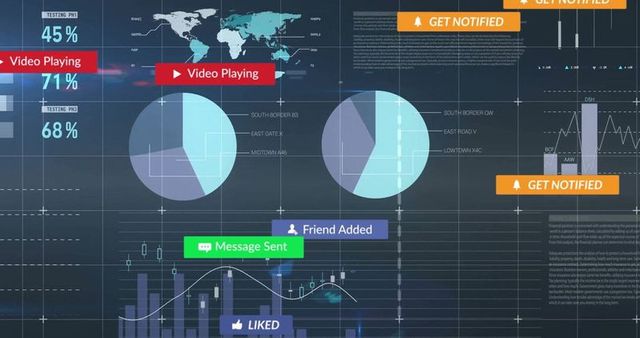
Visualizing digital trends and analytics in a dynamic user interface, ideal for presentations on data analysis, business intelligence, or technology briefings. Potential use includes workshops or webinars focused on effective data interpretation and technological integration.
Powered by  - Get 15% off with code: PIKWIZARD15


downloads
Tags:
More
Credit Photo
If you would like to credit the Photo, here are some ways you can do so
Text Link
photo Link
<span class="text-link">
<span>
<a target="_blank" href=https://pikwizard.com/photo/interactive-analytics-ui-with-charts-graphs-and-notifications/4432ca6f2275e2a95de5b40bb1a50e15/>PikWizard</a>
</span>
</span>
<span class="image-link">
<span
style="margin: 0 0 20px 0; display: inline-block; vertical-align: middle; width: 100%;"
>
<a
target="_blank"
href="https://pikwizard.com/photo/interactive-analytics-ui-with-charts-graphs-and-notifications/4432ca6f2275e2a95de5b40bb1a50e15/"
style="text-decoration: none; font-size: 10px; margin: 0;"
>
<img src="https://pikwizard.com/pw/medium/4432ca6f2275e2a95de5b40bb1a50e15.jpg" style="margin: 0; width: 100%;" alt="" />
<p style="font-size: 12px; margin: 0;">PikWizard</p>
</a>
</span>
</span>
Free (free of charge)
Free for personal and commercial use.
Author: Authentic Images
Similar Free Stock Images

Premium


Premium


Premium


Premium

Premium


Premium


Premium


Premium

Premium


Premium


Premium


Premium


Premium


Premium

Premium


Premium


Premium


Premium

Premium


Premium


Premium


Premium


Premium


Premium


Premium

Explore More Free Stock Images