
- Home >
- Stock Photos >
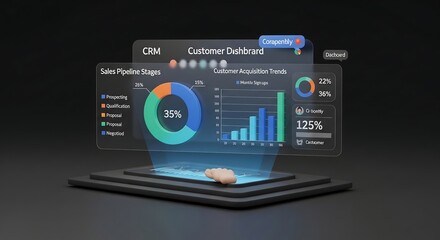
- Interactive Dashboard with Analytics and Charts
Interactive Dashboard with Analytics and Charts Image

Depicts a digital analytical dashboard showcasing interactive charts, statistics, and visualization tools. Blue chat widget indicates engagement and user count with the number '78'. Ideally used for presentations about business analytics, reports, technological advancements, or interfaces emphasizing data-driven decision-making and optimization.
Powered by 


downloads
Tags:
More
Credit Photo
If you would like to credit the Photo, here are some ways you can do so
Text Link
photo Link
<span class="text-link">
<span>
<a target="_blank" href=https://pikwizard.com/photo/interactive-dashboard-with-analytics-and-charts/bdd80ca1b64be62bd2cd8078125174d9/>PikWizard</a>
</span>
</span>
<span class="image-link">
<span
style="margin: 0 0 20px 0; display: inline-block; vertical-align: middle; width: 100%;"
>
<a
target="_blank"
href="https://pikwizard.com/photo/interactive-dashboard-with-analytics-and-charts/bdd80ca1b64be62bd2cd8078125174d9/"
style="text-decoration: none; font-size: 10px; margin: 0;"
>
<img src="https://pikwizard.com/pw/medium/bdd80ca1b64be62bd2cd8078125174d9.jpg" style="margin: 0; width: 100%;" alt="" />
<p style="font-size: 12px; margin: 0;">PikWizard</p>
</a>
</span>
</span>
Free (free of charge)
Free for personal and commercial use.
Author: People Creations
Similar Free Stock Images

Premium

Premium


Premium


Premium


Premium

Premium


Premium


Premium


Premium

Premium


Premium


Premium


Premium


Premium


Premium


Premium


Premium


Premium


Premium


Premium


Premium


Premium


Premium


Premium


Premium


Explore More Free Stock Images