- Home >
- Stock Photos >
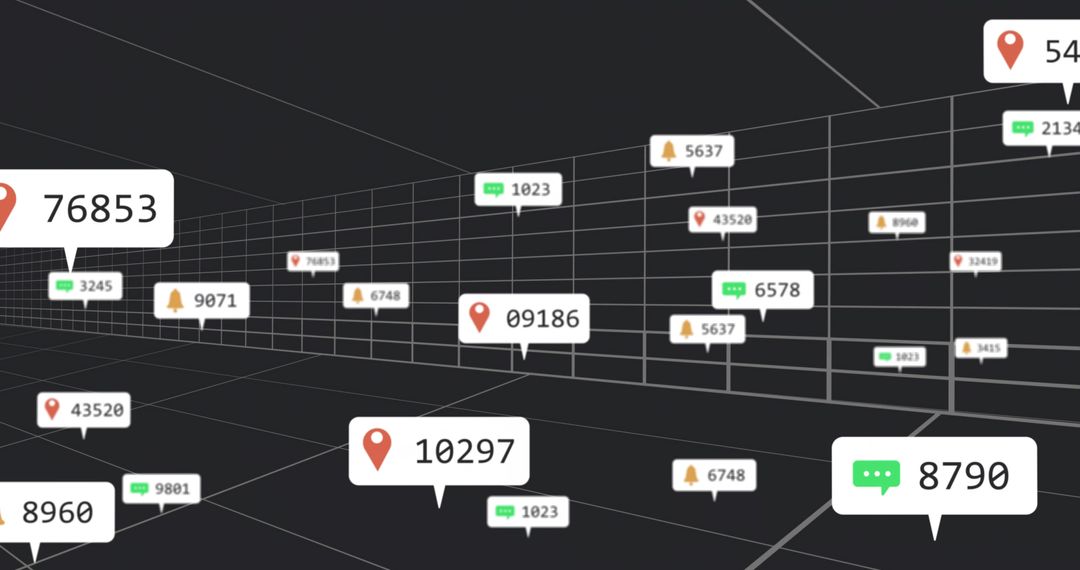
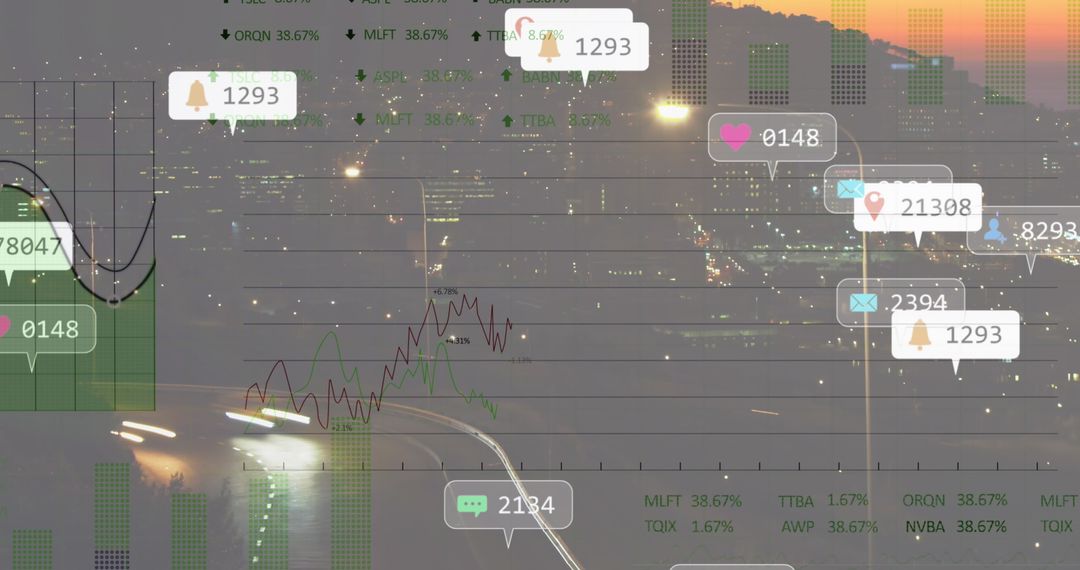
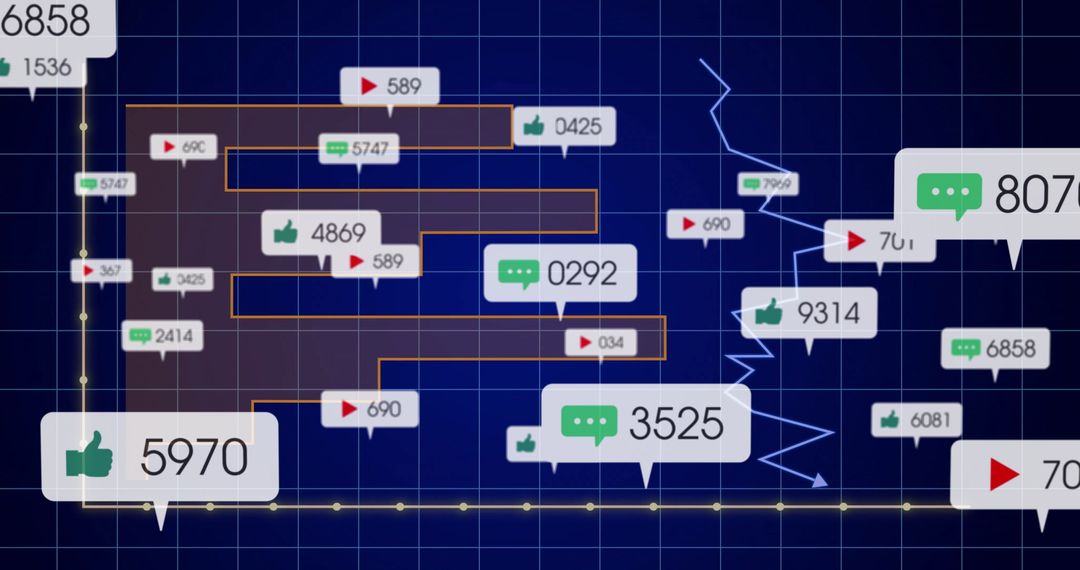
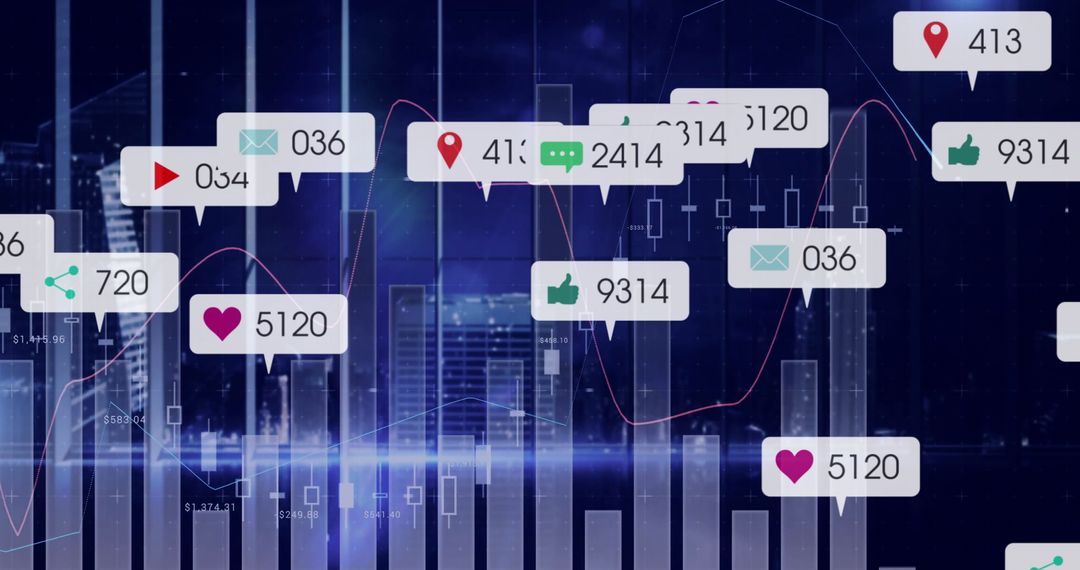
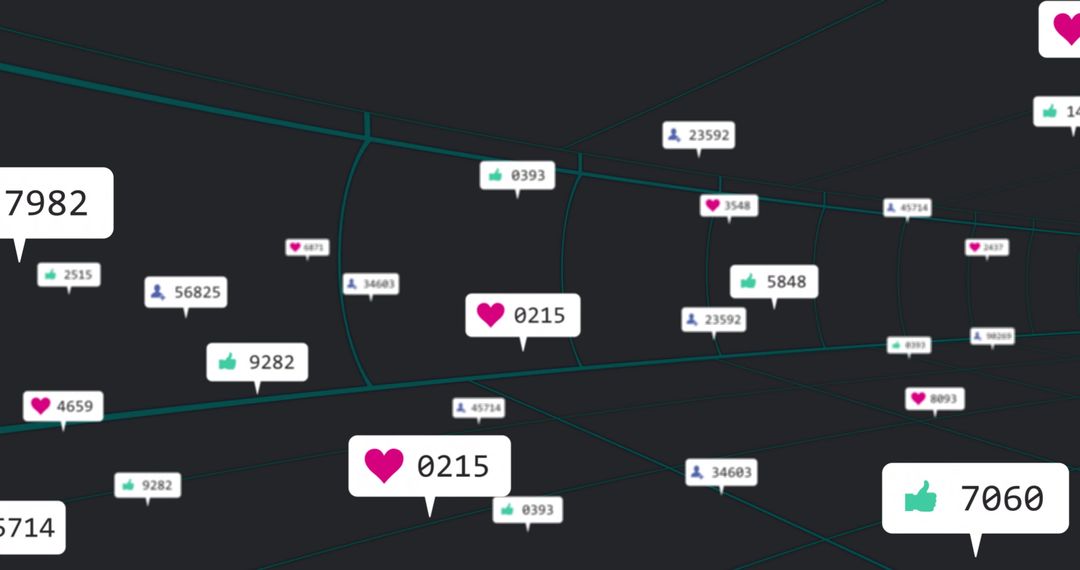
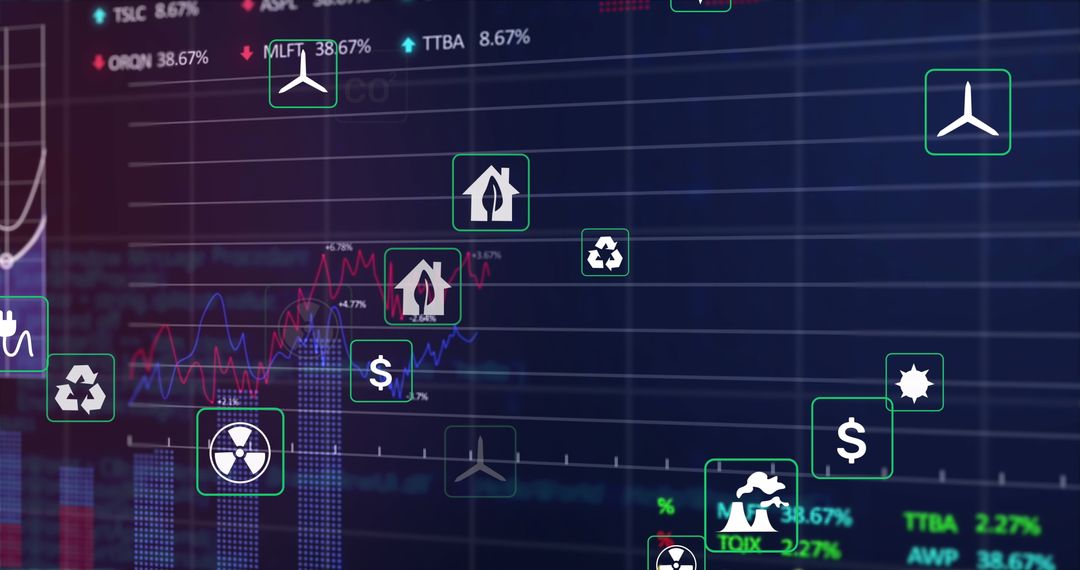
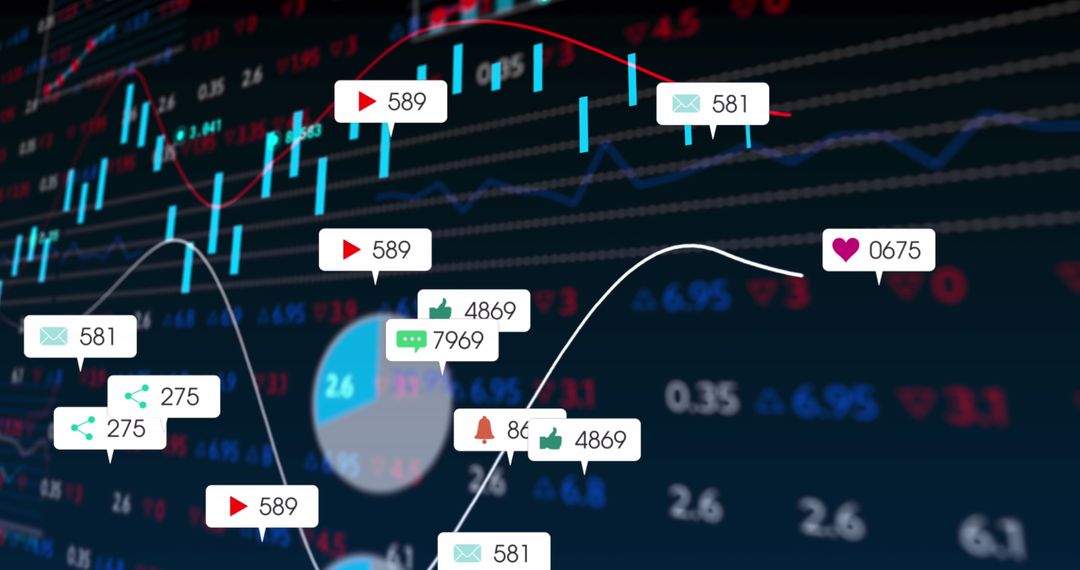
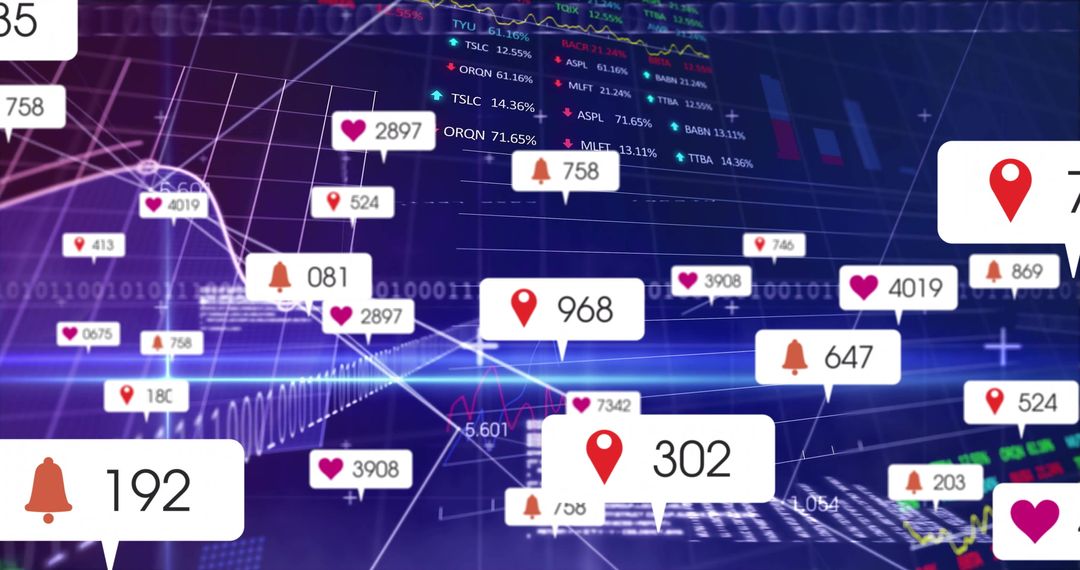
- Interactive Dashboard with Stock Candlestick Chart and Social Engagement
Interactive Dashboard with Stock Candlestick Chart and Social Engagement Image

Concept illustrates modern integration of stock trading data with real-time social engagement metrics. Useful for presentations on fintech innovations merging financial analytics with digital community feedback. Ideal for content on investment strategy, technology review, or digital market monitoring.
Powered by 


0
downloads
downloads
Tags:
More
Credit Photo
If you would like to credit the Photo, here are some ways you can do so
Text Link
photo Link
<span class="text-link">
<span>
<a target="_blank" href=https://pikwizard.com/photo/interactive-dashboard-with-stock-candlestick-chart-and-social-engagement/d1740f3483177ed8a26791a3f234cd76/>PikWizard</a>
</span>
</span>
<span class="image-link">
<span
style="margin: 0 0 20px 0; display: inline-block; vertical-align: middle; width: 100%;"
>
<a
target="_blank"
href="https://pikwizard.com/photo/interactive-dashboard-with-stock-candlestick-chart-and-social-engagement/d1740f3483177ed8a26791a3f234cd76/"
style="text-decoration: none; font-size: 10px; margin: 0;"
>
<img src="https://pikwizard.com/pw/medium/d1740f3483177ed8a26791a3f234cd76.jpg" style="margin: 0; width: 100%;" alt="" />
<p style="font-size: 12px; margin: 0;">PikWizard</p>
</a>
</span>
</span>
Free (free of charge)
Free for personal and commercial use.
Author: Creative Art
Similar Free Stock Images

Premium


Premium


Premium


Premium

Premium


Premium


Premium


Premium


Premium


Premium


Premium


Premium


Premium


Premium


Premium


Premium


Premium


Premium


Premium


Premium


Premium


Premium


Premium


Premium