- Home >
- Stock Photos >
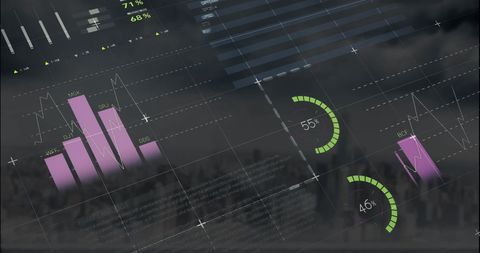
- Interactive Data Analysis with Graphs and Equations
Interactive Data Analysis with Graphs and Equations Image

This visually dynamic scene captures the integration of mathematical equations with data graphs, symbolizing advanced data analysis and scientific research. Well-suited for use in articles or presentations on statistical modeling, technology in science, or educational content explaining complex algorithms and data visualization techniques.

downloads
Tags:
More
Credit Photo
If you would like to credit the Photo, here are some ways you can do so
Text Link
photo Link
<span class="text-link">
<span>
<a target="_blank" href=https://pikwizard.com/photo/interactive-data-analysis-with-graphs-and-equations/929b96cc92650ba67448d6bc2a33daee/>PikWizard</a>
</span>
</span>
<span class="image-link">
<span
style="margin: 0 0 20px 0; display: inline-block; vertical-align: middle; width: 100%;"
>
<a
target="_blank"
href="https://pikwizard.com/photo/interactive-data-analysis-with-graphs-and-equations/929b96cc92650ba67448d6bc2a33daee/"
style="text-decoration: none; font-size: 10px; margin: 0;"
>
<img src="https://pikwizard.com/pw/medium/929b96cc92650ba67448d6bc2a33daee.jpg" style="margin: 0; width: 100%;" alt="" />
<p style="font-size: 12px; margin: 0;">PikWizard</p>
</a>
</span>
</span>
Free (free of charge)
Free for personal and commercial use.
Author: Creative Art