- Home >
- Stock Photos >
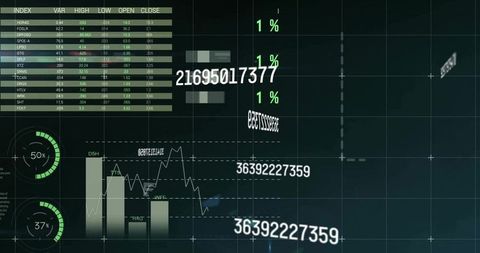
- Interactive Data Analytics and DNA Digital Interface
Interactive Data Analytics and DNA Digital Interface Image

Visual representation of complex statistical data processing intertwined with a dynamic DNA structure. Appealing for use in articles covering scientific research progress, biotechnology presentations, and technology-driven data analytics tools. Ideal for supplementing educational material on data science applications in modern medical research.

downloads
Tags:
More
Credit Photo
If you would like to credit the Photo, here are some ways you can do so
Text Link
photo Link
<span class="text-link">
<span>
<a target="_blank" href=https://pikwizard.com/photo/interactive-data-analytics-and-dna-digital-interface/17b9a47ebd94dfc9fce8592cbeb82cdd/>PikWizard</a>
</span>
</span>
<span class="image-link">
<span
style="margin: 0 0 20px 0; display: inline-block; vertical-align: middle; width: 100%;"
>
<a
target="_blank"
href="https://pikwizard.com/photo/interactive-data-analytics-and-dna-digital-interface/17b9a47ebd94dfc9fce8592cbeb82cdd/"
style="text-decoration: none; font-size: 10px; margin: 0;"
>
<img src="https://pikwizard.com/pw/medium/17b9a47ebd94dfc9fce8592cbeb82cdd.jpg" style="margin: 0; width: 100%;" alt="" />
<p style="font-size: 12px; margin: 0;">PikWizard</p>
</a>
</span>
</span>
Free (free of charge)
Free for personal and commercial use.
Author: Awesome Content