
- Home >
- Stock Photos >
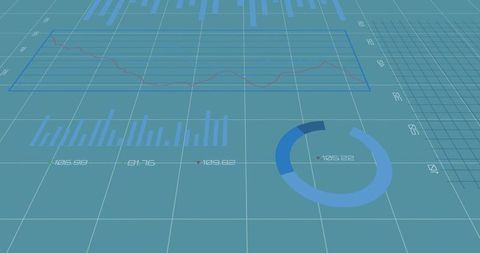
- Interactive Data Visualization Dashboard with 3D Bar and Line Graph Analysis
Interactive Data Visualization Dashboard with 3D Bar and Line Graph Analysis Image

The image showcases an interactive data visualization dashboard with 3D red bar columns and a red line graph. Various callouts indicate crucial data points, transforming complex data into understandable formats critical for business intelligence analysis. Useful for presentations on data management, statistical analysis, or corporate digital interfaces to illustrate modern analytical tools and methodologies.
Powered by 


downloads
Tags:
More
Credit Photo
If you would like to credit the Photo, here are some ways you can do so
Text Link
photo Link
<span class="text-link">
<span>
<a target="_blank" href=https://pikwizard.com/photo/interactive-data-visualization-dashboard-with-3d-bar-and-line-graph-analysis/2c611e39c46fe3259156a60e679519e8/>PikWizard</a>
</span>
</span>
<span class="image-link">
<span
style="margin: 0 0 20px 0; display: inline-block; vertical-align: middle; width: 100%;"
>
<a
target="_blank"
href="https://pikwizard.com/photo/interactive-data-visualization-dashboard-with-3d-bar-and-line-graph-analysis/2c611e39c46fe3259156a60e679519e8/"
style="text-decoration: none; font-size: 10px; margin: 0;"
>
<img src="https://pikwizard.com/pw/medium/2c611e39c46fe3259156a60e679519e8.jpg" style="margin: 0; width: 100%;" alt="" />
<p style="font-size: 12px; margin: 0;">PikWizard</p>
</a>
</span>
</span>
Free (free of charge)
Free for personal and commercial use.
Author: People Creations
Similar Free Stock Images

Premium


Premium


Premium


Premium


Premium


Premium


Premium


Premium


Premium


Premium


Premium


Premium


Premium


Premium


Premium


Premium


Premium

Premium

Premium


Premium

Premium

Premium


Premium


Premium


Premium


Explore More Free Stock Images