- Home >
- Stock Photos >
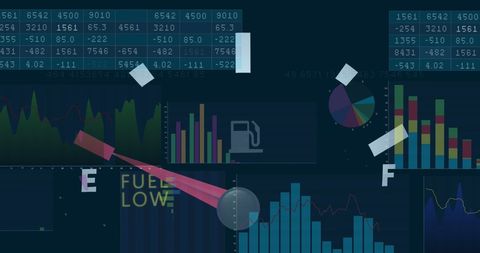
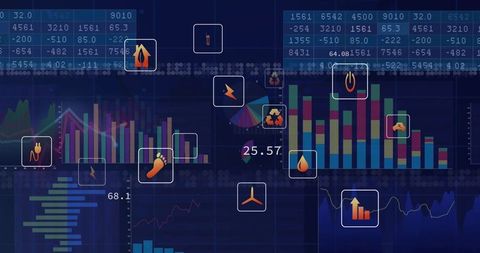
- Interactive Data Visualization Dashboard with Charts and Infographics
Interactive Data Visualization Dashboard with Charts and Infographics Image

This visual shows an advanced data visualization dashboard highlighting central numeric data surrounded by analytic charts and graphs. Ideal for illustrating business intelligence, tech presentations, or websites focusing on data analytics and digital interventions.

downloads
Tags:
More
Credit Photo
If you would like to credit the Photo, here are some ways you can do so
Text Link
photo Link
<span class="text-link">
<span>
<a target="_blank" href=https://pikwizard.com/photo/interactive-data-visualization-dashboard-with-charts-and-infographics/12bc298322b58c51631a689b89b870da/>PikWizard</a>
</span>
</span>
<span class="image-link">
<span
style="margin: 0 0 20px 0; display: inline-block; vertical-align: middle; width: 100%;"
>
<a
target="_blank"
href="https://pikwizard.com/photo/interactive-data-visualization-dashboard-with-charts-and-infographics/12bc298322b58c51631a689b89b870da/"
style="text-decoration: none; font-size: 10px; margin: 0;"
>
<img src="https://pikwizard.com/pw/medium/12bc298322b58c51631a689b89b870da.jpg" style="margin: 0; width: 100%;" alt="" />
<p style="font-size: 12px; margin: 0;">PikWizard</p>
</a>
</span>
</span>
Free (free of charge)
Free for personal and commercial use.
Author: People Creations